
'DeclarationPublic Class StockChart Inherits Chart
'UsageDim instance As StockChart
public class StockChart : Chart
The code below would display the following Chart:
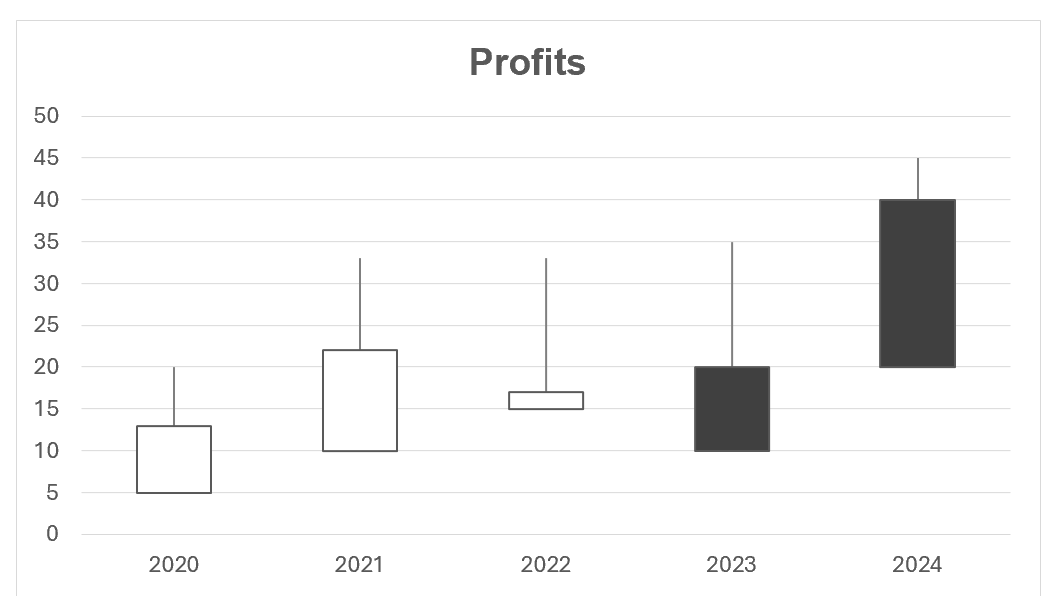
var workbook = Workbook.Create( ChartSample.ChartSampleOutputDirectory + @"AddCharts.xlsx" );

// Gets the first Worksheet. A Workbook always contains at least 1 Worksheet.
var worksheet = workbook.Worksheets[ 0 ];

// Adds Values for Category.
worksheet.Cells[ "B4" ].Value = 2020;
worksheet.Cells[ "B5" ].Value = 2021;
worksheet.Cells[ "B6" ].Value = 2022;
worksheet.Cells[ "B7" ].Value = 2023;
worksheet.Cells[ "B8" ].Value = 2024;

// Adds Values for Series.
worksheet.Cells[ "C4" ].Value = 20;
worksheet.Cells[ "C5" ].Value = 28;
worksheet.Cells[ "C6" ].Value = 33;
worksheet.Cells[ "C7" ].Value = 12;
worksheet.Cells[ "C8" ].Value = 45;
worksheet.Cells[ "D4" ].Value = 7;
worksheet.Cells[ "D5" ].Value = 33;
worksheet.Cells[ "D6" ].Value = 15;
worksheet.Cells[ "D7" ].Value = 35;
worksheet.Cells[ "D8" ].Value = 25;

// Adds a StockChart with the generic Add method and set its SubType. The size of the Chart will be from Cell E4 to L18.
var stockChart = worksheet.Charts.Add<StockChart>( "E4", "L18" );
stockChart.SubType = StockChartSubType.OpenHighLowClose;

// Sets the Chart's Title.
stockChart.Title.Text = "Profits";
stockChart.Title.TextOptions.Font.Bold = true;

// Sets the Category data(x values) for the StockChart : Cells B4 to B8.
stockChart.CategoryData = CategoryData.FromCells( worksheet, "B4", "B8" );

// Adds StockSeries to the StockChart (y values) by specifying fixed values, a Range of Cells’ Adresses and a Range of Cells’ Row & Column ids.
var stockSeriesOpen = stockChart.SeriesCollection.AddFromValues<StockSeries>( 5, 10, 15, 20, 40 );
var scatterSeriesHigh = stockChart.SeriesCollection.AddFromCells<StockSeries>( "C4", "C8" );
var scatterSeriesLow = stockChart.SeriesCollection.AddFromCells<StockSeries>( 3, 3, 7, 3 );
var stockSeriesClose = stockChart.SeriesCollection.AddFromValues<StockSeries>( 13, 22, 17, 10, 20 );

// Saves Workbook to disk.
workbook.Save();
System.Object
Xceed.Workbooks.NET.WorkbookElement
Xceed.Workbooks.NET.WorksheetElement
Xceed.Workbooks.NET.PositionedElement
Xceed.Workbooks.NET.Chart
Xceed.Workbooks.NET.StockChart
| Name | Description | |
|---|---|---|
 | StockChart Constructor | Creates a StockChart in the Worksheet. |
.NET: net5.0, net5.0-windows, net6.0, net6.0-macos, net6.0-windows, net7.0, net7.0-macos, net7.0-windows, net8.0, net8.0-browser, net8.0-macos, net8.0-windows, net9.0, net9.0-browser, net9.0-macos, net9.0-windows, net10.0, net10.0-browser, net10.0-macos, net10.0-windows.
.NET Framework: net40, net403, net45, net451, net452, net46, net461, net462, net463, net47, net471, net472, net48, net481.
