'DeclarationPublic Class CategoryAxis Inherits Axis
'UsageDim instance As CategoryAxis
public class CategoryAxis : Axis
The code below would display the following Chart:
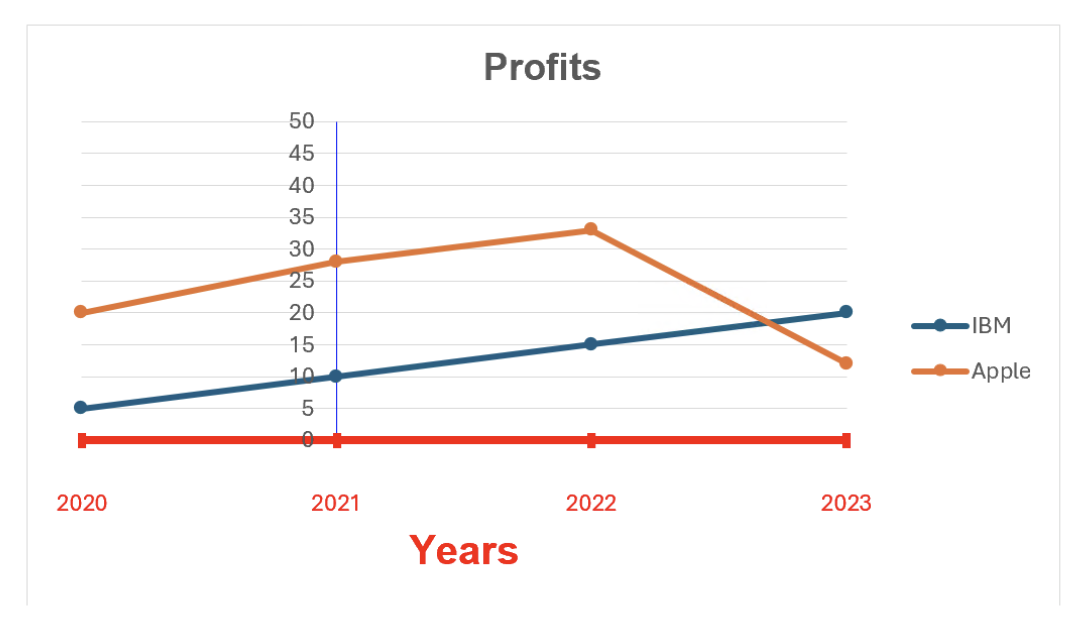
var workbook = Workbook.Create( ChartSample.ChartSampleOutputDirectory + @"AddCharts.xlsx" );

// Gets the first Worksheet. A Workbook always contains at least 1 Worksheet.
var worksheet = workbook.Worksheets[ 0 ];

// Adds Values for Category.
worksheet.Cells[ "B4" ].Value = new DateTime( 2020, 1, 1 );
worksheet.Cells[ "B5" ].Value = new DateTime( 2021, 1, 1 ); ;
worksheet.Cells[ "B6" ].Value = new DateTime( 2022, 1, 1 );
worksheet.Cells[ "B7" ].Value = new DateTime( 2023, 1, 1 );
worksheet.Cells[ "B8" ].Value = new DateTime( 2024, 1, 1 );

// Adds Values for Series.
worksheet.Cells[ "C4" ].Value = 20;
worksheet.Cells[ "C5" ].Value = 28;
worksheet.Cells[ "C6" ].Value = 33;
worksheet.Cells[ "C7" ].Value = 12;
worksheet.Cells[ "C8" ].Value = 45;

// Adds a LineChart with the generic Add method and set its SubType. The size of the Chart will be from Cell E4 to L18.
var lineChart = worksheet.Charts.Add<LineChart>( "E4", "L18" );
lineChart.SubType = LineChartSubType.LineWithMarkers;

// Sets the Chart's Title.
lineChart.Title.Text = "Profits";
lineChart.Title.TextOptions.Font.Bold = true;

// Sets the Legend.
lineChart.Legend.Position = LegendPositionType.Right;

// Sets the Category data(x values) for the LineChart : Cells B4 to B8.
lineChart.CategoryData = CategoryData.FromCells( worksheet, "B4", "B8" );

// Adds LineSeries to the LineChart (y values) by specifying fixed values and a Range of Cells’ Adresses.
var lineSeries1 = lineChart.SeriesCollection.AddFromValues<LineSeries>( 5, 10, 15, 20, 40 );
lineSeries1.Name = "IBM";
var lineSeries2 = lineChart.SeriesCollection.AddFromCells<LineSeries>( "C4", "C8" );
lineSeries2.Name = "Apple";

// Customizes the Category & Value Axis Line.
lineChart.ValueAxis.Line.Color = Xceed.Drawing.Color.Blue;
lineChart.CategoryAxis.Line.Color = Xceed.Drawing.Color.Red;
lineChart.CategoryAxis.Line.Width = 3d;

// Sets the minimum and maximum value for the CategoryAxis.
lineChart.CategoryAxis.Minimum = new DateTime( 2020, 1, 1 );
lineChart.CategoryAxis.Maximum = new DateTime( 2023, 1, 1 );

// Sets where the ValueAxis will cross the CategoryAxis.
lineChart.CategoryAxis.CrossPositionType = CrossPositionType.Custom;
lineChart.CategoryAxis.CrossPositionCustomValue = new DateTime( 2021, 1, 1 );

// Shows the Major Tickmarks on the CategoryAxis.
lineChart.CategoryAxis.MajorTickMarksType = TickMarksType.Cross;

// Sets the position of the CategoryAxis’ labels on the TickMarks.
lineChart.CategoryAxis.IsBetweenTickMarks = false;

// Customizes & formats the CategoryAxis’ labels to display only the years.
lineChart.CategoryAxis.TickLabelsDistanceFromAxis = 500;
lineChart.CategoryAxis.TickLabels.TextFill.Color = Xceed.Drawing.Color.Red;
lineChart.CategoryAxis.TickLabels.CustomFormat = "yyyy";

// Sets and customizes the CategoryAxis’ Title.
lineChart.CategoryAxis.Title.IsVisible = true;
lineChart.CategoryAxis.Title.Text = "Years";
lineChart.CategoryAxis.Title.TextOptions.TextFill.Color = Xceed.Drawing.Color.Red;
lineChart.CategoryAxis.Title.TextOptions.Font.Size = 15;
lineChart.CategoryAxis.Title.TextOptions.Font.Bold = true;

// Saves Workbook to disk.
workbook.Save();
System.Object
Xceed.Workbooks.NET.Axis
Xceed.Workbooks.NET.CategoryAxis
| Name | Description | |
|---|---|---|
 | CrossPositionCustomValue | Gets or sets the custom value that will be used to determine where the relative Axis will cross the Axis. (Inherited from Xceed.Workbooks.NET.Axis) |
| CrossPositionType | Gets or sets where the relative Axis will cross the Axis. (Inherited from Xceed.Workbooks.NET.Axis) |
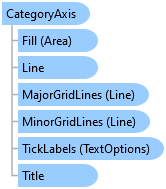
| Fill | Gets the Area that will be used to customize the background of the Axis' labels. (Inherited from Xceed.Workbooks.NET.Axis) |
| IsBetweenTickMarks | Gets or sets if the tick labels will be between the tick marks or on the tick marks. |
| IsReversed | Gets or sets if the Axis will be drawn in the reversed order. (Inherited from Xceed.Workbooks.NET.Axis) |
| IsVisible | Gets or sets if the Axis is visible or not. (Inherited from Xceed.Workbooks.NET.Axis) |
| Line | Gets the Axis' Line. (Inherited from Xceed.Workbooks.NET.Axis) |
| MajorGridLines | Gets the Axis' major gridlines. (Inherited from Xceed.Workbooks.NET.Axis) |
| MajorTickMarksType | Gets or sets the TickMarksType for the Axis' major ticks. (Inherited from Xceed.Workbooks.NET.Axis) |
| MajorUnit | Gets or sets the increment used to determine the space between each major tick marks. (Inherited from Xceed.Workbooks.NET.Axis) |
| Maximum | Gets or sets the maximum value that will be displayed on the CategoryAxis when using DateTime values. |
| Minimum | Gets or sets the minimum value that will be displayed on the CategoryAxis when using DateTime values. |
| MinorGridLines | Gets the Axis' minor gridlines. (Inherited from Xceed.Workbooks.NET.Axis) |
| MinorTickMarksType | Gets or sets the TickMarksType for the Axis' minor ticks. (Inherited from Xceed.Workbooks.NET.Axis) |
| MinorUnit | Gets or sets the increment used to determine the space between each minor tick marks. (Inherited from Xceed.Workbooks.NET.Axis) |
| TickLabels | Gets the Axis' tick labels. (Inherited from Xceed.Workbooks.NET.Axis) |
| TickLabelsDistanceFromAxis | Gets or sets the distance between the tick labels & the Axis. |
| TickLabelsInterval | Gets or sets the interval between each tick label. |
| TickLabelsPosition | Gets or sets the position of the tick labels on the Axis. (Inherited from Xceed.Workbooks.NET.Axis) |
| TickMarksInterval | Gets or sets the interval between each tick mark. |
| Title | Gets the Axis' title. (Inherited from Xceed.Workbooks.NET.Axis) |
.NET: net5.0, net5.0-windows, net6.0, net6.0-macos, net6.0-windows, net7.0, net7.0-macos, net7.0-windows, net8.0, net8.0-browser, net8.0-macos, net8.0-windows, net9.0, net9.0-browser, net9.0-macos, net9.0-windows, net10.0, net10.0-browser, net10.0-macos, net10.0-windows.
.NET Framework: net40, net403, net45, net451, net452, net46, net461, net462, net463, net47, net471, net472, net48, net481.