'DeclarationPublic Class PieOfChart Inherits Chart
'UsageDim instance As PieOfChart
public class PieOfChart : Chart
The code below would display the following Chart:
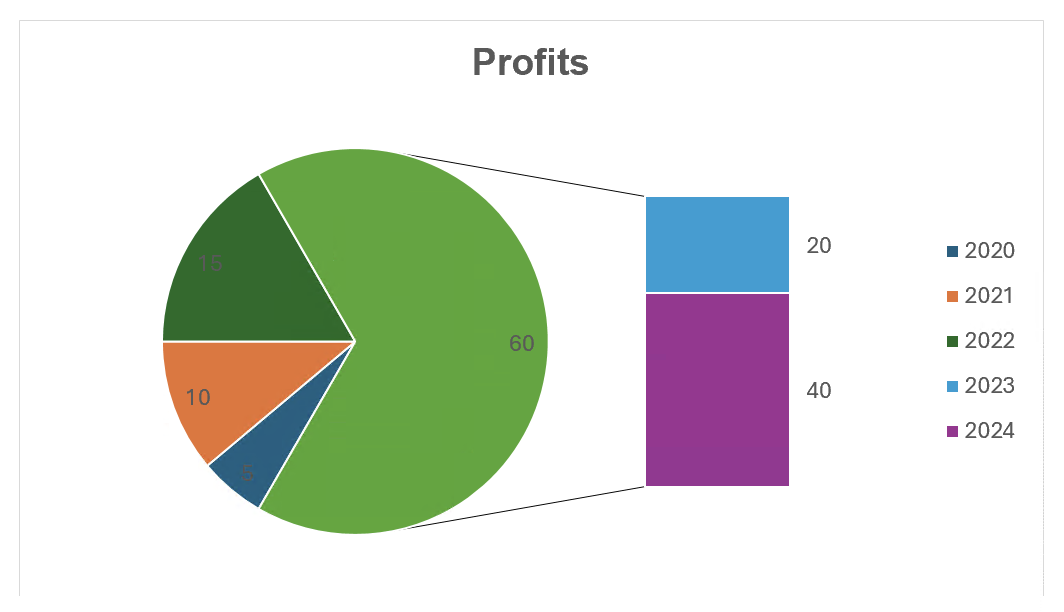
var workbook = Workbook.Create( ChartSample.ChartSampleOutputDirectory + @"AddCharts.xlsx" );

// Gets the first Worksheet. A Workbook contains at least 1 Worksheet.
var worksheet = workbook.Worksheets[ 0 ];

// Adds Values for Category.
worksheet.Cells[ "B4" ].Value = 2020;
worksheet.Cells[ "B5" ].Value = 2021;
worksheet.Cells[ "B6" ].Value = 2022;
worksheet.Cells[ "B7" ].Value = 2023;
worksheet.Cells[ "B8" ].Value = 2024;

// Adds Values for Series.
worksheet.Cells[ "C4" ].Value = 20;
worksheet.Cells[ "C5" ].Value = 28;
worksheet.Cells[ "C6" ].Value = 33;
worksheet.Cells[ "C7" ].Value = 12;
worksheet.Cells[ "C8" ].Value = 45;
worksheet.Cells[ "D4" ].Value = 7;
worksheet.Cells[ "D5" ].Value = 33;
worksheet.Cells[ "D6" ].Value = 15;
worksheet.Cells[ "D7" ].Value = 35;
worksheet.Cells[ "D8" ].Value = 25;

// Adds a PieOfChart with the generic Add method and set its SubType. The size of the Chart will be from Cell E4 to L18.
var pieOfChart = worksheet.Charts.Add<PieOfChart>( "E4", "L18" );
pieOfChart.SubType = PieOfChartSubType.Bar;

// Sets the Chart's Title.
pieOfChart.Title.Text = "Profits";
pieOfChart.Title.TextOptions.Font.Bold = true;

// Sets the Legend.
pieOfChart.Legend.Position = LegendPositionType.Right;

// Sets the Category data(x values) for the PieOfChart : Cells B4 to B8.
pieOfChart.CategoryData = CategoryData.FromCells( worksheet, "B4", "B8" );

// Adds PieSeries to the PieOfChart (y values) by specifying fixed values, a Range of Cells’ Adresses and a Range of Cells’ Row & Column ids.
var pieSeries1 = pieOfChart.SeriesCollection.AddFromValues<PieSeries>( 5, 10, 15, 20, 40 );
pieSeries1.Name = "IBM";

// Shows the values of the DataPointLabels.
pieSeries1.DataPointLabels.ShowValue = true;


// Saves Workbook to disk.
workbook.Save();
System.Object
Xceed.Workbooks.NET.WorkbookElement
Xceed.Workbooks.NET.WorksheetElement
Xceed.Workbooks.NET.PositionedElement
Xceed.Workbooks.NET.Chart
Xceed.Workbooks.NET.PieOfChart
| Name | Description | |
|---|---|---|
 | PieOfChart Constructor | Creates a PieOfChart in the Worksheet. |
| Name | Description | |
|---|---|---|
 | AbsolutePosition | Gets or sets the absolute Position of the PositionedElement. (Inherited from Xceed.Workbooks.NET.PositionedElement) |
| AnchorPosition | Gets or sets the position of the Anchor in the Worksheet. (Inherited from Xceed.Workbooks.NET.PositionedElement) |
| AnchorType | Gets the Anchor's type. (Inherited from Xceed.Workbooks.NET.PositionedElement) |
| Border | Gets the Chart's Border. (Inherited from Xceed.Workbooks.NET.Chart) |
| BottomRightOffsets | Gets or sets the value used to offset the bottom right corner of a TwoCellAnchor PositionedElement. (Inherited from Xceed.Workbooks.NET.PositionedElement) |
| CategoryAxis | Gets the Chart's CategoryAxis. (Inherited from Xceed.Workbooks.NET.Chart) |
| CategoryData | Gets or sets the CategoryData that will be used for the Chart's CategoryAxis. (Inherited from Xceed.Workbooks.NET.Chart) |
| Description | Gets or sets the PositionedElement's description. (Inherited from Xceed.Workbooks.NET.PositionedElement) |
| DrawingClientData | Gets the DrawingClientData, which is how the data should behave when the Worksheet is protected. (Inherited from Xceed.Workbooks.NET.PositionedElement) |
| Fill | Gets the Chart's Fill. (Inherited from Xceed.Workbooks.NET.Chart) |
| GapWidth | Gets or sets the spacing between the main pie & the bar or second pie. |
| Height | Gets or sets the height of an AbsoluteAnchor or OneCellAnchor PositionedElement. (Inherited from Xceed.Workbooks.NET.PositionedElement) |
| IsColorVariedByPoint | Gets or sets if the Chart automatically varies Colors for its Series' data. (Inherited from Xceed.Workbooks.NET.Chart) |
| IsRoundedCorners | Gets or sets if the Chart has rounded corners. (Inherited from Xceed.Workbooks.NET.Chart) |
| Legend | Gets the Chart's Legend. (Inherited from Xceed.Workbooks.NET.Chart) |
| MeasureUnit | Gets or sets the Units used for measuring the PositionedElement's Width & Height. (Inherited from Xceed.Workbooks.NET.PositionedElement) |
| Name | Gets or sets the name of the PositionedElement. (Inherited from Xceed.Workbooks.NET.PositionedElement) |
| PlotArea | Gets the Chart's PlotArea. (Inherited from Xceed.Workbooks.NET.Chart) |
| SecondaryCategoryAxis | Gets the Chart's secondary CategoryAxis. (Inherited from Xceed.Workbooks.NET.Chart) |
| SecondaryValueAxis | Gets the Chart's secondary ValueAxis. (Inherited from Xceed.Workbooks.NET.Chart) |
| SecondPlotSize | Gets or sets the size of the bar or second pie in relation to the main pie. |
| SeriesCollection | Gets the Chart's SeriesCollection. (Inherited from Xceed.Workbooks.NET.Chart) |
| SeriesLine | Gets the Line joining the main pie & the bar or second pie. |
| SplitType | Gets or sets the type of split used by the PieOfChart, as well as what to show in the bar or second pie. |
| SplitValue | Gets or sets the value that will be used in tandem with the SplitType property to show values in the bar or second pie. |
| SubType | Gets or sets the PieOfChart's sub type. |
| Title | Gets or sets the Chart's title. (Inherited from Xceed.Workbooks.NET.Chart) |
| TopLeftOffsets | Gets or sets the value used to offset the top right corner of a TwoCellAnchor PositionedElement. (Inherited from Xceed.Workbooks.NET.PositionedElement) |
| TwoCellAnchorBehavior | Gets or sets the behavior of a TwoCellAnchor PositionedElement when moving or deleting Rows or Columns. (Inherited from Xceed.Workbooks.NET.PositionedElement) |
| ValueAxis | Gets the Chart's ValueAxis. (Inherited from Xceed.Workbooks.NET.Chart) |
| Width | Gets or sets the width of an AbsoluteAnchor or OneCellAnchor PositionedElement. (Inherited from Xceed.Workbooks.NET.PositionedElement) |
.NET: net5.0, net5.0-windows, net6.0, net6.0-macos, net6.0-windows, net7.0, net7.0-macos, net7.0-windows, net8.0, net8.0-browser, net8.0-macos, net8.0-windows, net9.0, net9.0-browser, net9.0-macos, net9.0-windows, net10.0, net10.0-browser, net10.0-macos, net10.0-windows.
.NET Framework: net40, net403, net45, net451, net452, net46, net461, net462, net463, net47, net471, net472, net48, net481.