XYZ Scatter Point charts are created by using an instance of the PointSeries object. Both the UseXValues (inherited from the XYScatterSeries base class) and the UseZValues properties must be set to true. The following figure demonstrates an XYZ scatter point chart.
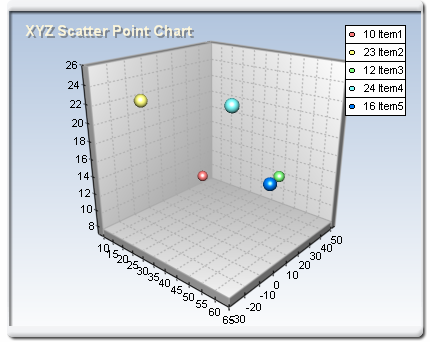
figure 1.
Notes on Scaling XYZ Scatter Point Charts
Custom X-coordinates (extracted from the XValues data series) are scaled on the specified X-axis (by default the PrimaryX axis), while custom Z-coordinates are scaled on the Depth axis.
Since both the PrimaryX and Depth axes by default operate in Dimension mode, the user must manually change this scaling mode to one of the value scaling modes (Numeric, DateTime or Logarithmic). The following code will correctly display an XYZ scatter point chart.
| VB.NET | |
|---|---|
| |
| C# | |
|---|---|
// there is one chart created by default point.UseXValue = true; chart.Axis(StandardAxis.PrimaryX).ScaleMode = AxisScaleMode.Numeric; | |
Please refer to the Axis Scales topic for more information.
Related Examples
Windows Forms: Series\Point\XYZ Scatter Point
Windows Forms: Series\Point\XYZ Multi Series Scatter Point