All axes of the Xceed Chart component can work in four scale modes (for details, see AxisScaleMode Enumeration): Dimension, Numeric, Logarithmic, and DateTime. By default the vertical axes of the component operate in Numeric mode while the horizontal and depth axis operate in Dimension mode. The Logarithmic mode is primarily used for vertical axes. The DateTime mode is primarily used for horizontal axes.
Default Axis Scaling Mode
The following table summarizes the default scaling modes of the standard axes:
| Standard Axis | Default Scaling Mode |
| PrimaryY | Numeric |
| SecondaryY | Numeric |
| PrimaryX | Dimension |
| SecondaryX | Dimension |
| Depth | Dimension |
Controlling the Axis Scale Mode
The scale mode of the axis is controlled by the ScaleMode property of the Axis class. It is of type AxisScaleMode and can accept the following values:
Dimension
Numeric
Logarithmic
DateTime
For example, the following code will switch the PrimaryX axis to DateTime mode.
| VB.NET | |
|---|---|
| |
| C# | |
|---|---|
| |
Controlling the Current Axis Scale
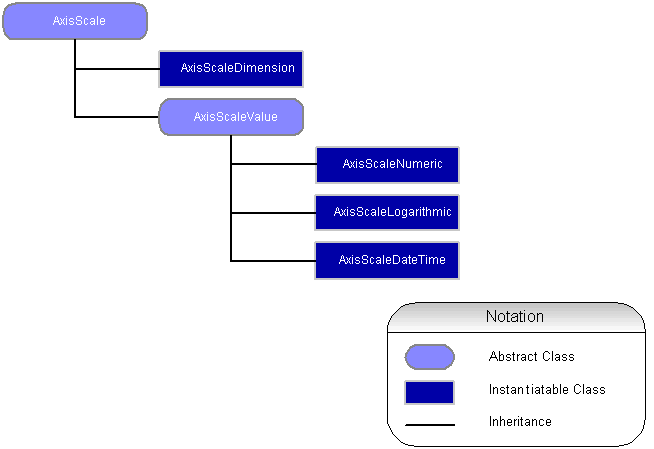
Each of the four scaling modes is represented by an instance of AxisScaleDimension, AxisScaleNumeric, AxisScaleLogarithmic, and AxisScaleDateTime classes, respectively. The DimensionScale, NumericScale, LogarithmicScale, and DateTimeScale properties of the Axis object give you access to the instances of these classes.
Scale Hierarchy
The following diagram represents the hierarchy of the axis scales:

Basic Scale Functionality
Each of the four possible scaling modes is represented by an instance of an AxisScale derived class. The base AxisScale class implements the following basic axis scale functionality:
- Minor tick count control: the MinorTickCount property controls the count of the automatic minor ticks of all derived scaling modes.
- Control over the automatic generation of axis labels displayed on major tick values. By default the axis scale produces automatic texts that are displayed on major tick values. The user can override this behavior by setting the AutoLabels property to false and manually specifying the labels (with the Labels property of the Axis object). The following example displays three user-specified labels at the first three major ticks of a Dimension scale.
| VB.NET | |
|---|---|
| |
| C# | |
|---|---|
| |
Value Scale Functionality
The AxisScaleValue class is a base class of the AxisScaleNumeric , AxisScaleLogarithmic, and AxisScaleDateTime classes. It derives from AxisScale and implements support for the following functionality:
- Control over the generation of the minor ticks. By default the axis scale automatically produces minor ticks. The user can turn off this behavior with the AutoMinorTicks property and manually specify values on which minor ticks should be displayed.
- Control over the axis scale's min and max values. By default the min and max values are automatically calculated. The user can specify manual min and max values by setting the AutoMin and AutoMax properties to false and then specifying the desired min and max values by setting the Min and Max properties. The following code switches the PrimaryY axis to numeric mode and specifies manual min and max values.
| VB.NET | |
|---|---|
| |
| C# | |
|---|---|
| |
- Control over the density of the automatically generated major ticks. When the scale determines the step of the major ticks, it takes into account the MaxTickCount property through which you can control the density of the ruler ticks. Although the actual number of ruler ticks may not be equal to the value specified by the MaxTickCount property, it is guaranteed that this number will never exceed this value. By default it set to 10.
- Round to tick functionality. The user can specify whether the axis scale should begin and end on exact tick values with the help of the RoundToTickMin and RoundToTickMax properties. By default they are set to false.
See Also
AxisScale | AxisScaleValue | AxisScaleDimension | AxisScaleNumeric | AxisScaleLogarithmic | AxisScaleDateTime
