Dimension scale mode is the default scale mode of the PrimaryX, SecondaryX, and Depth chart axes (for details, see StandardAxis Enumeration). When operating in this mode, the axes are scaled in accordance to the specific chart dimension. For example, the horizontal axes will be scaled to fit the series containing maximum data points. The Depth axis is scaled to fit all displayed series.
The properties of the dimension scale are controlled through an instance of the AxisScaleDimension class, which is accessible through the DimensionScale property of the Axis class. The AxisScaleDimension class is a direct descendant of the AxisScale class and inherits all its functionality. It also implements control over the following aspects of a dimension scale.
Controlling Data Point Layout Relative to Major Ticks
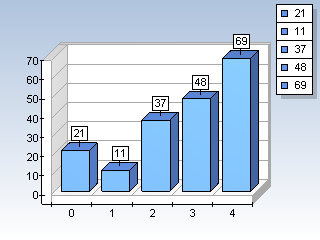
By default the data points that are scaled on a dimension scale are positioned between major ticks. The user can override this behavior by setting the DisplayDataPointsBetweenTicks property to false. The PrimaryX axis on the following figures is displayed in the two possible data point layouts.
 |
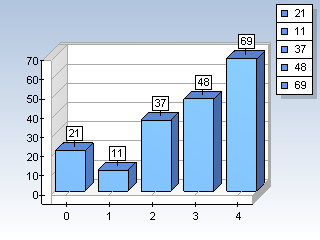 |
| PrimaryX Axis with Data Points between Ticks | PrimaryY Axis with Data Points on Tick Marks |
Note: When the DisplayDataPointsBetweenTicks property is set to false, you may need to set the InflateMargins flag of the displayed series to true in order to fit the entire series into the chart area.
| VB.NET | |
|---|---|
bar.InflateMargins = True | |
| C# | |
|---|---|
bar.InflateMargins = true; | |
Controlling the Density of Major Ticks
The user can control the number of data points that lay between two major ticks with the NumberOfDataPointsBetweenTicks property. By default it is set to 1. The following code will display two data points between two major tick marks:
| VB.NET | |
|---|---|
Chart.Axis(PrimaryX).DimensionScale.NumberOfDataPointsBetweenTicks = 2 | |
| C# | |
|---|---|
Chart.Axis(PrimaryX).DimensionScale.NumberOfDataPointsBetweenTicks = 2; | |
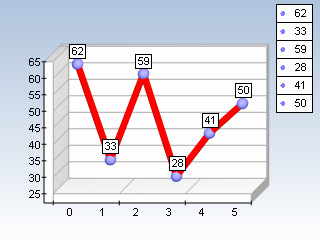
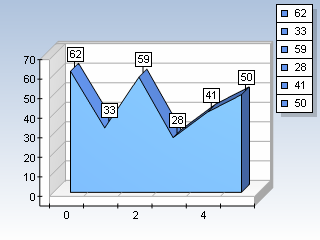
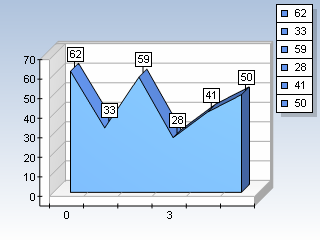
The following images demonstrate the effect of the NumberOfDataPointsBetweenTicks property.
 |
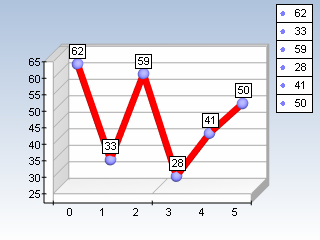 |
| NumberOfDataPointsBetweenTicks Set to 2 | NumberOfDataPointsBetweenTicks Set to 3 |
Controlling the Density of Auto Labels
The user can also control the number of data points that lay between two automatic labels with the NumberOfDataPointsBetweenLabels property. By default it is set to 1. The following code will display two data points between two labels:
| VB.NET | |
|---|---|
Chart.Axis(PrimaryX).DimensionScale.NumberOfDataPointsBetweenLabels = 2 | |
| C# | |
|---|---|
Chart.Axis(PrimaryX).DimensionScale.NumberOfDataPointsBetweenLabels = 2; | |
The following images demonstrate the effect of the NumberOfDataPointsBetweenLabels property.
 |
 |
| NumberOfDataPointsBetweenLabels Set to 2 | NumberOfDataPointsBetweenLabels Set to 3 |
Related Examples
Windows Forms: Axes\Scaling\Dimension Scale
