'DeclarationPublic Class ColumnSeries Inherits Series
'UsageDim instance As ColumnSeries
public class ColumnSeries : Series
The code below would display the following Chart:
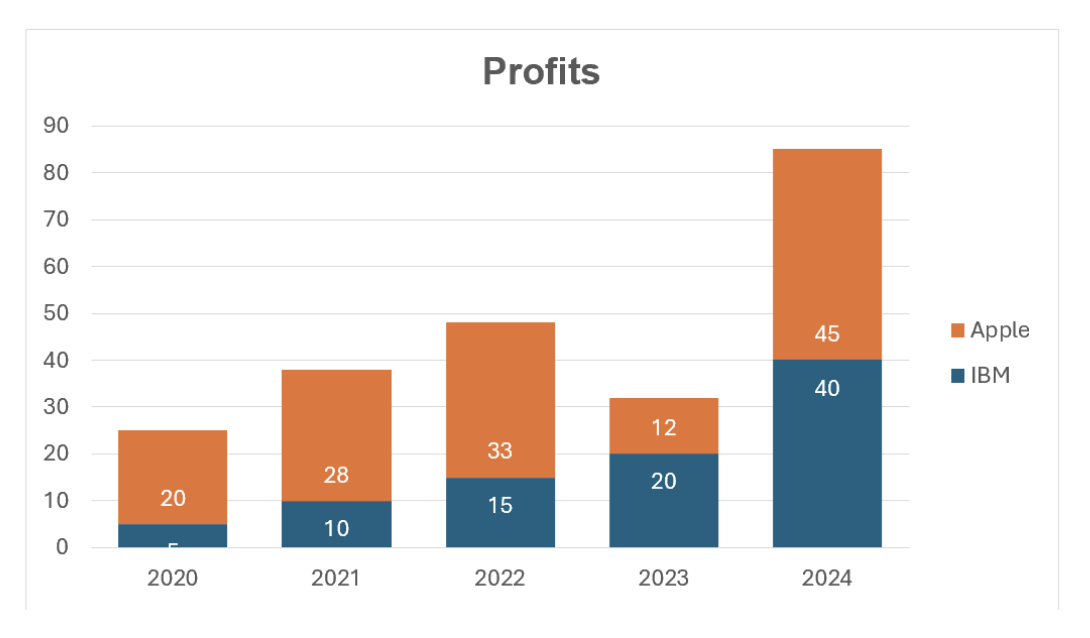
var workbook = Workbook.Create( ChartSample.ChartSampleOutputDirectory + @"AddCharts.xlsx" );

// Gets the first Worksheet. A Workbook always contains at least 1 Worksheet.
var worksheet = workbook.Worksheets[ 0 ];

// Adds Values for Category.
worksheet.Cells[ "B4" ].Value = 2020;
worksheet.Cells[ "B5" ].Value = 2021;
worksheet.Cells[ "B6" ].Value = 2022;
worksheet.Cells[ "B7" ].Value = 2023;
worksheet.Cells[ "B8" ].Value = 2024;

// Adds Values for Series.
worksheet.Cells[ "C4" ].Value = 20d;
worksheet.Cells[ "C5" ].Value = 28d;
worksheet.Cells[ "C6" ].Value = 33d;
worksheet.Cells[ "C7" ].Value = 12d;
worksheet.Cells[ "C8" ].Value = 45d;

// Adds a BubbleChart with the generic Add method and set its SubType. The size of the Chart will be from Cell E4 to L18.
var columnChart = worksheet.Charts.Add<ColumnChart>( "E4", "L18" );
columnChart.SubType = ColumnChartSubType.Stacked;

// Sets the Chart's Title.
columnChart.Title.Text = "Profits";
columnChart.Title.TextOptions.Font.Bold = true;

// Sets the Legend.
columnChart.Legend.Position = LegendPositionType.Right;

// Sets the Category data(x values) for the ColumnChart : Cells B4 to B8.
columnChart.CategoryData = CategoryData.FromCells( worksheet, "B4", "B8" );

// Sets the space between the Columns to 50%.
columnChart.GapWidth = 50;

// Adds ColumnSeries to the ColumnChart (y values) by specifying fixed values and a range of Cells’ Adresses.
var columnSeries1 = columnChart.SeriesCollection.AddFromValues<ColumnSeries>( 5d, 10d, 15d, 20d, 40d );
columnSeries1.Name = "IBM";
var columnSeries2 = columnChart.SeriesCollection.AddFromCells<ColumnSeries>( "C4", "C8" );
columnSeries2.Name = "Apple";

// Shows the DataPoint Labels for the ColumnSeries and positions them.
columnSeries1.DataPointLabels.ShowValue = true;
columnSeries1.DataPointLabels.Position = SurfaceDataPointLabelsPositionType.InsideEnd;
columnSeries1.DataPointLabels.TextOptions.TextFill.Color = Xceed.Drawing.Color.White;
columnSeries2.DataPointLabels.ShowValue = true;
columnSeries2.DataPointLabels.Position = SurfaceDataPointLabelsPositionType.InsideBase;
columnSeries2.DataPointLabels.TextOptions.TextFill.Color = Xceed.Drawing.Color.White;

// Saves Workbook to disk.
workbook.Save();
System.Object
Xceed.Workbooks.NET.WorkbookElement
Xceed.Workbooks.NET.WorksheetElement
Xceed.Workbooks.NET.ChartValueRange
Xceed.Workbooks.NET.Series
Xceed.Workbooks.NET.ColumnSeries
Xceed.Workbooks.NET.BarSeries
| Name | Description | |
|---|---|---|
 | ColumnSeries Constructor | Creates a ColumnSeries in the Chart. |
| Name | Description | |
|---|---|---|
 | CellRange | Gets the CellRange associated with the ChartValueRange. (Inherited from Xceed.Workbooks.NET.ChartValueRange) |
| DataPointLabels | Gets the ColumnSeries' data labels. |
| Fill | Gets the Area that will be filled with a color. (Inherited from Xceed.Workbooks.NET.Series) |
| Name | Gets or sets the Series' name. (Inherited from Xceed.Workbooks.NET.Series) |
| PlotOnSecondaryAxis | Gets or sets if the Series is plotted on the secondary Axis. (Inherited from Xceed.Workbooks.NET.Series) |
| Stroke | Gets the Line associated with the Series. (Inherited from Xceed.Workbooks.NET.Series) |
| Values | Gets or sets the values associated with the ChartValueRange. (Inherited from Xceed.Workbooks.NET.ChartValueRange) |
.NET: net5.0, net5.0-windows, net6.0, net6.0-macos, net6.0-windows, net7.0, net7.0-macos, net7.0-windows, net8.0, net8.0-browser, net8.0-macos, net8.0-windows, net9.0, net9.0-browser, net9.0-macos, net9.0-windows, net10.0, net10.0-browser, net10.0-macos, net10.0-windows.
.NET Framework: net40, net403, net45, net451, net452, net46, net461, net462, net463, net47, net471, net472, net48, net481.