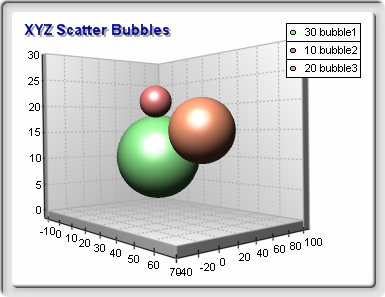
m_Chart = chartControl1.Charts[0];
// switch the PrimaryX and Depth axes in numeric mode in order to
// correctly scale the custom X and Z positions
m_Chart.Axis(StandardAxis.PrimaryX).ScaleMode = AxisScaleMode.Numeric;
m_Chart.Axis(StandardAxis.Depth).ScaleMode = AxisScaleMode.Numeric;
// create the shape series
m_Shape = (ShapeSeries)m_Chart.Series.Add(SeriesType.Shape);
// configure it
// 1. filling is specified per data point
m_Shape.Appearance.FillMode = AppearanceFillMode.DataPoints;
// 2. borders are also specified per data point
m_Shape.Appearance.LineMode = AppearanceLineMode.DataPoints;
// 3. show information about the data points in the legend
m_Shape.Legend.Mode = SeriesLegendMode.DataPoints;
// 4. show the Y size and label in the legend
m_Shape.Legend.Format = "<ysize> <label>";
// 5. no data labels m_Shape.DataLabels.Mode = DataLabelsMode.None;
// use custom X positions
m_Shape.UseXValues = true;
// use custom Z positions
m_Shape.UseZValues = true;
// X sizes are specified in Model units (the default is Scale)
// this will make the bubbles size independant from the scale of the X axis
m_Shape.XSizesUnits = MeasurementUnits.Model;
// Z sizes are specified in Model units (the default is Scale)
// this will make the bubbles size independant from the scale of the Z axis
m_Shape.ZSizesUnits = MeasurementUnits.Model;
// Y sizes are specified in Model units (the default is Scale)
// this will make the bubbles size independant from the scale of the Y axis
m_Shape.YSizesUnits = MeasurementUnits.Model;
// this will require to set the InflateMargins flag to true since in this mode
// scale is determined only by the X positions of the shape and will not take
// into account the size of the bubbles.
m_Shape.InflateMargins = true;
// add the bubbles
// add bubble1
m_Shape.AddShape(10, // Y center of bubble
12, // X position
56, // Z position
30, // X size - 30 model units
30, // Y size - 30 model units
30, // Z size - 30 model units
"bubble1", // label
new FillEffect(Color.LightGreen), // filling
new LineProperties(1, Color.Black) // border
};
// add bubble2
m_Shape.AddShape(20, // Y center of bubble
34, // X position - not used since UseXValue is set to false
12, // Z position
10, // X size - 10 model units
10, // Y size - 10 model units
10, // Z size - 10 model units
"bubble2", // label
new FillEffect(Color.LightCoral), // filling
new LineProperties(1, Color.Black) // border
);
// add bubble3
m_Shape.AddShape( 15, // Y center of bubble -> half its Y size
50, // X position - not used since UseXValue is set to false
30, // Z position
20, // X size - 20 model units
20, // Y size - 20 model units
20, // Z size - 20 model units
"bubble3", // label
new FillEffect(Color.LightSalmon), // filling
new LineProperties(1, Color.Black) // border
}