Xceed Chart for WinForms v4.4 Documentation
Shape charts are created by using an instance of the ShapeSeries object. It is derived from the XYScatterSeries base class and inherits all its functionality.
The shape series is a versatile rendering series. For each shape series, the user can specify the style of the shapes (bar, sphere, pyramid, etc.), as well as the X, Y, and Z coordinates of the shape and its size along the X, Y, and Z dimensions. It can be used to display XYZ scatter bubbles, and XY and XYZ scatter bar charts. It can also be used for the rendering of custom (user-defined) charts and composite objects.
The following image was rendered with several instances of the shape series.
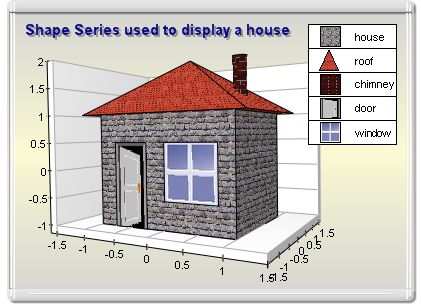
figure 1.
An instance of the ShapeSeries class can be obtained from the SeriesCollection.Add method. The method will add the newly created series to the series collection and return a reference to it. If the user wants to save the reference for further use, it must be explicitly cast to the ShapeSeries type. The following code will create a ShapeSeries object in the series collection and save the returned reference:
| VB.NET | |
|---|---|
| |
| C# | |
|---|---|
// there is one chart created by default // add a shape series to it | |
Once the shape series is created, you can add data to it. The Shape series uses the Values data series of the Series class for the shape's Y center position and the XValues data series of XYScatterSeries for the shape's X center position. The helper methods provided by the Series and XYScatterSeries classes can be used to insert values in the data series that are to be used.
In addition to the standard Values and XValues data series, the bubble series also adds another data series of type Double:
ZValues: Holds the Z-coordinate of the sizes.
XSizes: Holds the size of the shapes in the X-dimension.
YSizes: Holds the size of the shapes in the Y-dimension.: Holds the size of the shapes in the Z-dimension.
ZSizes
In addition to the standard helper methods for feeding data inherited from the Series class (see the One Value Series Functionality topic) and the XYScatterSeries class (see the XY Scatter Series Functionality topic), the ShapeeSeries implements the following routines.
public void AddShape(double y, double x, double z, double xsize, double ysize, double zsize) - Adds a new shape.
public void AddShape(double y, double x, double z, double xsize, double ysize, double zsize, string label) - Adds a new shape with assigned label.
public void AddShape(double y, double x, double z, double xsize, double ysize, double zsize, string label, FillEffect pointFE) - Adds a new shape with assigned label and fill effect.
public void AddShape(double y, double x, double z, double xsize, double ysize, double zsize, string label, FillEffect pointFE, LineProperties pointBorder) - Adds a new shape with assigned label and fill effect and border.
For example, you can add data to a simple shape chart with the following code:
| VB.NET | |
|---|---|
| |
| C# | |
|---|---|
shape.AddShape(10, 10, 1, 1, 2, 1); | |
A labeled shape can be created like this:
| VB.NET | |
|---|---|
| |
| C# | |
|---|---|
| |
A shape series with different fill effects is also easy to create:
| VB.NET | |
|---|---|
| |
| C# | |
|---|---|
shape.AddShape(10, 10, 1, 1, 2, 1, "Shape 1", new FillEffect(Color.Red)); // show only the labels in the data labels // instruct the bubble to use the data point fill effects | |
The shape of the bubbles can be controlled from the ShapeStyle property. It is of type BarStyle and accepts the following values (for details, see BarStyle Enumeration):
Bar
Cylinder
Cone
InvertedCone
Pyramid
InvertedPyramid
Ellipsoid
SmoothEdgeBar
CutEdgeBar
For example, the following code will display the shapes as smooth-edge bars:
| VB.NET | |
|---|---|
shape.ShapeStyle = BarStyle.SmoothEdgeBar | |
| C# | |
|---|---|
shape.ShapeStyle = BarStyle.SmoothEdgeBar; | |
By default all shapes are displayed with the filling specified by the FillEffect object accessible through the ShapeFillEffect property and the border specified by the LineProperties object accessible through the ShapeBorder property. The following example will display all shapes in green with a blue border.
| VB.NET | |
|---|---|
| |
| C# | |
|---|---|
shape.ShapeFillEffect.SetSolidColor(Color.Green); | |
Please refer to the Series Appearance topic, which describes how to apply individual fillings and lines to the series data points.
The size of the shape along the X,Y, and Z dimensions can be specified in two ways. By default it is specified in Scale units, which means that the actual size of the shape may decrease if the range scaled by the axes is increased. A common requirement for shapes is to have a size independent of the axis scale; for example, the XYZ scatter Bubble needs to have its sizes specified in this way.
The XSizesUnits, YSizesUnits, and ZSizesUnits properties of the ShapeSeries class help you specify the type of units used for shape sizes. They are of type MeasurementUnits, but can only accept the Scale and Model settings.
The UseXValues and UseZValues flags of the ShapeSeries class determine whether the shape series must use the provided X and Z center coordinates or use default ones (0, 1, 2, etc). If you intend to set them to true, make sure that you switch the X and Depth axis to a Value Scale mode (Numeric, Date-Time, or Logarithmic) in order to scale the coordinates correctly.
| VB.NET | |
|---|---|
| |
| C# | |
|---|---|
| |
The ShapeSeries class extends the formatting command set inherited from the XYScatterSeries base class with the following formatting commands:
<zvalue> - The current data point zvalue (Z coordinate).
<xsize> - The current data point x size (size along the X dimension).
<ysize> - The current data point y size (size along the Y dimension).
<zsize> - The current data point z size (size along the Z dimension).
The following code will display the shape sizes in the legend:
| VB.NET | |
|---|---|
| |
| C# | |
|---|---|
shape.Legend.Mode = SeriesLegendMode.DataPoints; | |
Windows Forms: Series\Shape\Standard Shape
Windows Forms: Series\Shape\3D Modeling with shapes