Most of the objects in the chart have associated texts. The ChartText object allows you to modify various aspects of the text's appearance, including the following:
-
font
-
text type - plain or XML formatted
-
text appearance - fill effect, shadow, border
-
text orientation
-
horizontal and vertical alignment relative to the text origin point
-
offset from the origin point
-
text backplane
-
depth order mode of the text
Changing the Font of the ChartText Object
The Font property is the most important property of the ChartText object. It accepts an object of type System.Drawing.Font. The default font used in 3D Chart for WinForms is Arial 9, but some objects modify it. For example, header and footer labels use Arial 12. The code below changes the font of a text:
| VB.NET | |
|---|---|
textProps.Font = new Font("Arial", 22)
| |
| C# | |
|---|---|
textProps.Font = new Font("Arial", 22);
| |
Font fill effect
The filling of the text is controlled by the FillEffect property of the ChartText object. This property exposes a regular FillEffect object, which can apply solid color, gradient, image, pattern or advanced gradient filling to the text object. The following code sets a solid color for the text:
| VB.NET | |
|---|---|
textProps.FillEffect.SetSolidColor(Color.Aqua) | |
| C# | |
|---|---|
textProps.FillEffect.SetSolidColor(Color.Aqua); | |
For more information about the FillEffect object, please refer to the Fill Effects Overview topic.
Text Backplane of the ChartText Object
You can use the backplane of the text for various purposes: for example, to draw the user's attention to the text or to increase its readability. A typical scenario is if you have a black background color, and the font color is also black. In this case you have to enable the text backplane, because otherwise the text will simply merge with the background and become unreadable. The text backplane is represented by the Backplane object, accessible from the Backplane property of the ChartText object:
| VB.NET | |
|---|---|
| |
| C# | |
|---|---|
| |
For more information, consult the Backplanes topic.
Text Offset of the ChartText Object
When rendering is performed the control automatically calculates the points in the scene where texts should appear. These points are called base points and their coordinates are based on the scene logic. For example when you have a bar chart it will position the base points for the bar label texts at the top of each bar. The origin point of a text is always specified relative to the base point. This is achieved with the help of the Offset property of the text. It is a PointF object with X and Y coordinates defined in pixels and by default zero. The following example offsets the origin point of a text from its base point with ten pixels (right and down):
| VB.NET | |
|---|---|
| |
| C# | |
|---|---|
| |
Horizontal and Vertical Alignment of the Text Object
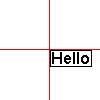
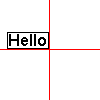
Besides the offset from the base point, you can also control how the text is aligned relative to the origin point. The following table shows this:
| Horizontal align Vertical align |
Center | Left | Right |
| Center | 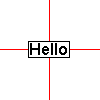 |
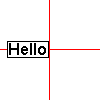 |
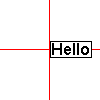 |
| Top | 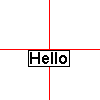 |
 |
 |
| Bottom | 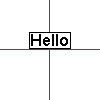 |
 |
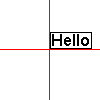 |
The red lines represent where the origin point is.
Orientation of the ChartText Object
Text orientation is specified by the Orientation property of the ChartText object rather than with the orientation property of the associated font. The Orientation property is specified in degrees (counter-clockwise) and by default is 0. The example below creates a vertically oriented label:
| VB.NET | |
|---|---|
textProp.Orientation = 90 | |
| C# | |
|---|---|
textProp.Orientation = 90; | |
Z-Position of the ChartText Object
When Xceed Chart for WinForms renders objects with associated texts like bars, axes, etc., it generates a base point with a Z-value equal to the object's Z-value. You can instruct the ChartText object whether or not to render the text at the same Z-value as the base point with the help of the TextOverlapsImage property. When set to true, the text will always overlap the chart. The following example instructs the bar labels to use the Z-value of the bar they are attached to. This is why these objects will disappear when overlapped by a chart element closer to the viewer.
| VB.NET | |
|---|---|
| |
| C# | |
|---|---|
| |
