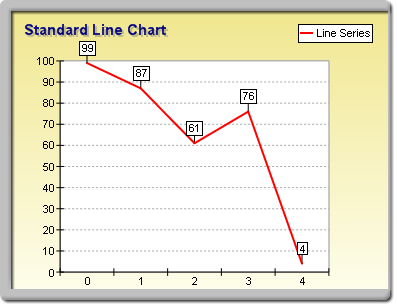
Standard line charts are created with an instance of the LineSeries class. It is derived from the XYScatterSeries base class and inherits all its functionality. The following figure represents a typical line chart.
figure 1.
Creating the Standard Line Series
An instance of the LineSeries class can be obtained from the SeriesCollection.Add method. The method will add the newly created series to the series collection and return a reference to it. If the user wants to save the reference for further use, it must be explicitly cast to the LineSeries type. The following code will create a LineSeries object in the series collection and save the returned reference:
VB.NET
' there is one chart created by default
Dim chart As Chart = CType(chartControl1.Charts(0), Chart)
' add line series to it
Dim line As LineSeries = CType(Chart.Series.Add(SeriesType.Line), LineSeries)
C#
// there is one chart created by default
Chart chart = (Chart)chartControl1.Charts[0];
// add line series to it
LineSeries line = (LineSeries)Chart.Series.Add(SeriesType.Line);
Passing Data to the Standard Line Series
Once the line series is created, you can add data to it. Line series use the Values data series of the Series class for the line values and the XValues data series of the XYScatterSeries for the custom x positions of the data points. The helper methods provided by the Series and XYScatterSeries classes can be used to insert values into the data series that will be used.
For example, the following code was used to pass the data to the chart shown in figure 1.
line.AddXY(62, new DateTime(2003, 3, 24).ToOADate());
line.AddXY(33, new DateTime(2003, 4, 14).ToOADate());
line.AddXY(59, new DateTime(2003, 5, 54).ToOADate());
// instruct the chart to use the custom x date time positions
line.UseXValues = true;
chart.Axis(StandardAxis.PrimaryY).ScaleMode = AxisScaleMode.DateTime;
// and format the ticks as date times
chart.Axis(StandardAxis.PrimaryX).ValueFormat.Format = ValueFormat.Date;
Generic labeled XY scatter line charts are easy to create:
VB.NET
line.AddXY(62, 34, "Apples")
line.AddXY(33, 53, "Oranges")
line.AddXY(59, 43, "Bananas")
' instruct the chart to use the custom x date time positions
// instruct the chart to use the custom x date time positions
line.UseXValues = true;
chart.Axis(StandardAxis.PrimaryY).ScaleMode = AxisScaleMode.Numeric;
// display label string in the data points labels
line.DataPoints.Format = "<label>";
Controlling the Line Shape
The line series can be displayed in several styles. The user controls the display style with the LineStyle property. It is of type LineSeriesStyle and can accept the following values (see LineSeriesStyle Enumeration for details):
Line: The line is displayed as a simple line. Tape: The line is displayed as tape. Tube: The line is displayed as tube segments. Ellipsoid: The line is displayed as ellipsoid segments.
By default this property is set to Line. The following example will display the line as tape:
VB.NET
line.LineStyle = LineSeriesStyle.Tape
C#
line.LineStyle = LineSeriesStyle.Tape;
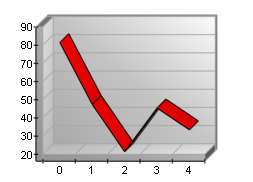
Demonstration of Line Styles
Tape
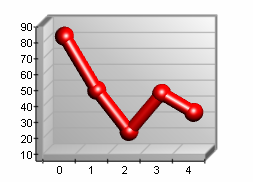
Tube (with Sphere Markers)
Ellipsoid
Controlling the Line Depth
When the line is displayed in Tape, Tube, Ellipsoid, or Line mode, the DepthPercent property of the LineSeries object specifies the depth of the line segments in percent values of the floor grid-cells it occupies. By default it is set to 50. The following code will increase the depth of the line:
VB.NET
line.DepthPercent = 60
C#
line.DepthPercent = 60;
Controlling the Line Appearance
By default the line is displayed with the filling specified by the FillEffect object accessible through the LineFillEffect property and the border specified by the LineProperties object accessible through the LineBorder property. The following example will display a line with Tape style in blue with a yellow border.
If the line series is displayed with Line style, the width of the line is controlled with the Width property of the LineProperties object. The following code will display a red line with a width of 3 pixels: