Once a value has been assigned to the empty data point, it can be displayed in a variety of ways. The appearance of the empty data point is controlled by an EmptyDataPointsAppearance object attached to each SeriesBase class. An instance of this class can be obtained with the EmptyDataPointsAppearance property of the SeriesBase class.
| VB.NET | |
|---|---|
Dim edpAppearance As EmptyDataPointsAppearance = series.EmptyDataPointsAppearance | |
| C# | |
|---|---|
EmptyDataPointsAppearance edpAppearance = series.EmptyDataPointsAppearance; | |
The way in which empty data points are displayed is controlled by the Mode property, which is of type EmptyDataPointsAppearanceMode and can accept the following values (for details, see EmptyDataPointsAppearanceMode Enumeration):
Normal
DifferentAppearance
Marker
The following is a description of these modes:
-
Normal: In this mode the data point is displayed as if it were a normal data point, and the series is responsible for assigning fill effect and line properties to the data point.
-
DifferentAppearance: In this mode the data points that were empty (before the component assigned values to them) are displayed with user-defined fill effect and line properties. This is very useful if you want to distinguish between these data points and the normal data points. The shape of the data point (or segment between data points) is determined by the series type: only the appearance is different. The user can control the applied fill effect through the FillEffect property of the EmptyDataPointsAppearance class and the applied line properties from the LineProps property of the same class.
| VB.NET | |
|---|---|
| |
| C# | |
|---|---|
| |
-
Marker: In this mode the data points that were empty (before the component assigned values to them) are displayed with a user-defined marker. The properties of the marker are controlled with the Markers object accessible from the Markers property.
| VB.NET | |
|---|---|
| |
| C# | |
|---|---|
| |
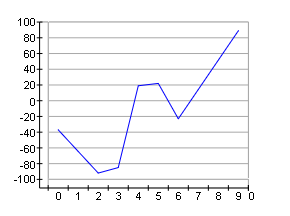
|
Chart with Empty Data Points |
| Normal (displayed as if no empty data points were detected) |
 |
| Different Appearance (red segments connect empty data points) |
 |
| Marker (Empty data points displayed as markers. Note that the blue points represent line values, which were not connected) |
 |
Related Examples
Windows Forms: Series\Data Manipulation\EmptyData Points\EmptyData Points