Stock stick charts are created by using an instance of the StockSeries object. It is derived from the XYScatterSeries base class and inherits all its functionality. Stock sticks are created when the CandleStyle property of the StockSeries object is set to Stick.
| VB.NET | |
|---|---|
stock.CandleStyle = CandleStyle.Stick | |
| C# | |
|---|---|
stock.CandleStyle = CandleStyle.Stick; | |
The following figure represents a typical stock stick chart.
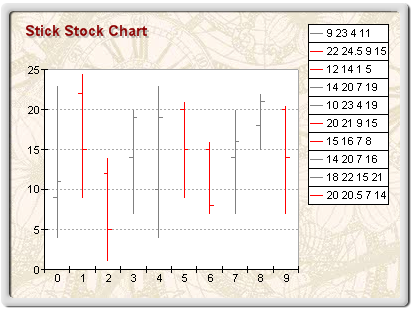
figure 1.
Differences between Candle Stock and Stick Stock Series
Stock series displayed in stick mode differ from stock series displayed in candle mode in the following ways:
1. Control over the Visibility of Open and Close Values
Since open and close values are displayed as ticks on the line connecting the high and low values, the user can control their visibility with the help of the ShowOpen and ShowClose properties, which are by default set to true. The following code will display a High-Low-Close chart.
| VB.NET | |
|---|---|
| |
| C# | |
|---|---|
stock.ShowOpen = false; | |
Analogously, the following code will display a High-Low-Open chart:
| VB.NET | |
|---|---|
| |
| C# | |
|---|---|
stock.ShowOpen = true; | |
2. Passing Data
Since the open and close values are not mandatory for the display, the user can also use the following helper routines.
void AddStock(double open, double high, double low) - Adds (open - high - low) values.
void AddStock(double high, double low, double close) - Adds (high - low - close) values.
void AddStock(double xvalue, double open, double high, double low) - Adds (open - high - low) values at custom X-position.
void AddStock(double xvalue, double high, double low, double close) - Adds (high - low - close) values at custom X-position.
An open-high-low-close stock with stick style is created with the following code:
| VB.NET | |
|---|---|
| |
| C# | |
|---|---|
stock.AddStock(10, 22, 8, 14); | |
A more complex date-time stock stick chart can be displayed like this:
| VB.NET | |
|---|---|
| |
| C# | |
|---|---|
stock.AddStock(new DateTime(2003, 3, 24).ToOADate(), 10, 22, 8, 14); // instruct the chart to use the custom x date time positions | |
3. Display Logic
To differentiate sticks with "up" and "down" orientation, the entire stick is displayed with the line properties specified by the UpLineProps or DownLineProps .
Related Examples
Windows Forms: Series\Stock\Stick
Windows Forms: Series\Stock\DateTime Stock
Windows Forms: Series\Combo Charts\Financial chart example