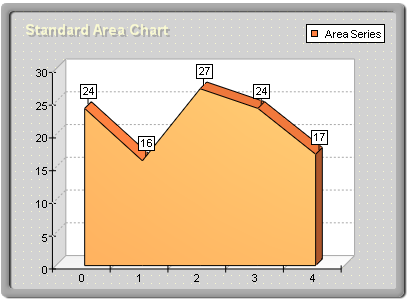
Standard area charts are created with an instance of the AreaSeries class. It is derived from the XYScatterSeries base class and inherits all its functionality. The following figure represents a typical area chart:
figure 1.
Creating the Standard Area Series
An instance of the AreaSeries class can be obtained from the SeriesCollection.Add method. The method will add the newly created series to the series collection and return a reference to it. If the user wants to save the reference for further use, it must be explicitly cast to the AreaSeries type. The following code will create a AreaSeries object in the series collection and save the returned reference:
VB.NET
' there is one chart created by default
Dim chart As Chart = CType(chartControl1.Charts(0), Chart)
' add area series to it
Dim area As AreaSeries = CType(Chart.Series.Add(SeriesType.Area), AreaSeries)
C#
// there is one chart created by default
Chart chart = (Chart)chartControl1.Charts[0];
// add area series to it
AreaSeries area = (AreaSeries)Chart.Series.Add(SeriesType.Area);
Passing Data to the Standard Area Series
Once the area series is created, you can add data to it. Area series use the Values data series of the Series class for the area values and the XValues data series of the XYScatterSeries for the custom x-positions of the data points. The helper methods provided by the Series and XYScatterSeries classes can be used to insert values in the data series that are to be used.
For example, the following code was used to feed the data to the chart in figure 1.
area.AddXY(62, new DateTime(2003, 3, 24).ToOADate());
area.AddXY(33, new DateTime(2003, 4, 14).ToOADate());
area.AddXY(59, new DateTime(2003, 5, 54).ToOADate());
// instruct the chart to use the custom x date time positions
area.UseXValues = true;
chart.Axis(StandardAxis.PrimaryY).ScaleMode = AxisScaleMode.DateTime;
// and format the ticks as date times
chart.Axis(StandardAxis.PrimaryX).ValueFormat.Format = ValueFormat.Date;
Generic labeled XY scatter area charts are easy:
VB.NET
area.AddXY(62, 34, "Apples")
area.AddXY(33, 53, "Oranges")
area.AddXY(59, 43, "Bananas")
' instruct the chart to use the custom x date time positions
// instruct the chart to use the custom x date time positions
area.UseXValues = true;
chart.Axis(StandardAxis.PrimaryY).ScaleMode = AxisScaleMode.Numeric;
// display label string in the data points labels
area.DataPoints.Format = "<label>";
Controlling the Depth of the Standard Area
The depth of the area is specified in percent values of the grid cell-depth it occupies. The DepthPercent property controls this percentage. By default it is set to 50. The following code will make the area bigger in depth:
VB.NET
area.DepthPercent = 70
C#
area.DepthPercent = 70;
Controlling the Appearance of the Standard Area
By default the area is displayed with the filling specified by the FillEffect object accessible through the AreaFillEffect property and the border specified by the LineProperties object accessible through the AreaBorder property. The following example displays the area in blue with a yellow border.
Please refer to the Series Appearance topic, which describes how to apply individual fillings and lines to the series data points.
Controlling the Origin of the Standard Area
By default the area uses zero as its origin (the area begins at zero). The user can turn off this behavior by setting the UseOrigin property to false.
VB.NET
area.UseOrigin = False
C#
area.UseOrigin = false;
If the area is not using an origin value, it will begin at the minimum area value (the minimal area value will be displayed with zero height).
In some cases, the user may want the area to begin at a certain value, for example, 26. The following code will achieve this result:
VB.NET
area.UseOrigin = True
area.Origin = 26
C#
area.UseOrigin = true;
area.Origin = 26;
Drop Lines and the Standard Area Series
Drop lines are lines separating the area segments. The user controls their visibility with the DropLines property. By default it is set to false. The following code will display the drop lines: