Stacked area charts are created by using several instances of the AreaSeries class. The first area series created must have its MultiAreaMode property set to Series. The MultiAreaMode property of the subsequent area series must be set to MultiAreaMode.Stacked. Stacked areas series are displayed on top of each other. The following figure shows a typical stack area chart:
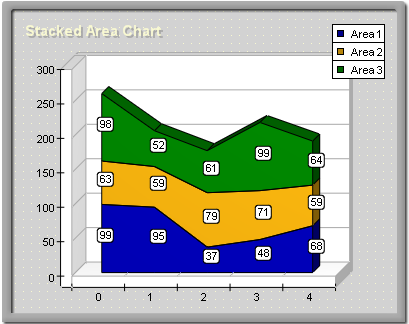
figure 1.
Creating the Stacked Area Series
The following example demonstrates how to create a stack area chart with two stacks:
| VB.NET | |
|---|---|
| |
| C# | |
|---|---|
// there is one chart created by default AreaSeries area1 = (AreaSeries)chart.Series.Add(SeriesType.Area); area1.MultiAreaMode = MultiAreaMode.Series; | |
If you want to create a second stacked area with two stacks behind the stack area created in the previous sample, you must add the following code:
| VB.NET | |
|---|---|
| |
| C# | |
|---|---|
AreaSeries area4 = (AreaSeries)Chart.Series.Add(SeriesType.Area); area4.MultiAreaMode = MultiAreaMode.Series; | |
Stack Origin
When an area series is stacked, it is always displayed with origin 0, regardless of the values of the UseOrigin and Origin properties.
Stacks with Negative Values
Stacked percent area charts do not support negative values, which means that all values are internally converted to their absolute value.
Stacked Area Formatting Commands
The following formatting commands inherited from the Series class have different meanings when an area series is stacked:
<total> - Displays the absolute sum of the values in the current stack.
<cumulative> - Displays the sum of the values up to the current stack value.
<percent> - Displays the percent contribution of the value to the total pile sum.
Related Examples
Windows Forms: Series\Area\Stacked Area