So far we've been working with a single chart and legend, which is the default configuration of Xceed Chart for WinForms. You can, however, create an unlimited number of charts and legends and display them in the control's canvas. To accomplish this, you must add new instances of Chart and Legend objects to the Charts and Legends collections of the control, respectively.
Adding a New Chart
You add a new chart by adding an instance of the Chart class to the Charts collection of the control. For example:
VB.NET
Dim chart As Chart =  New Chart()
chartControl1.Charts.Add(chart)
C#
Chart chart = new Chart();
chartControl1.Charts.Add(chart);
By default there is always one chart, so you can always index the first chart in the collection at startup:
VB.NET
Dim chart As Chart = chartControl1.Charts(0)
C#
Chart chart = chartControl1.Charts[0];
You must keep in mind that you can modify some of the properties of the chart only after adding it to the Charts collection. For example, the property DispayOnLegend can be modified only after you add the chart:
VB.NET
Dim chart2 As Chart =  New Chart()
chartControl1.Charts.Add(chart2)
chart2.DisplayOnLegend = 1
C#
Chart chart = new Chart();
chartControl1.Charts.Add(chart);
chart2.DisplayOnLegend = 1;
You can associate one chart with only one legend, but one legend can have many associated charts displaying data on it. Of course, the legend mode should be set to Automatic. Otherwise, the data supplied by the chart(s) will be discarded.
Chart Margins
By default the chart occupies the whole control area. When you have multiple charts, however, you'll have to alter this layout because otherwise the charts will overlap. This can be achieved by modifying the margins of the chart:
VB.NET
Dim chart As Chart =  New Chart()
chartControl1.Charts.Add(chart)
chart.Margins = New RectangleF(50, 0, 50, 100)
C#
Chart chart = new Chart();
chartControl1.Charts.Add(chart);
chart.Margins = new RectangleF(50, 0, 50, 100);
This code will position the new blank chart in the right half of the control canvas. The margins are specified in percent values of the control window's width and height.
Adding New Legends
You add a new legend by adding an instance of the Legend class to the Legends collection of the control. For example:
VB.NET
Dim legend As Legend =  New Chart()
chartControl1.Legends.Add(legend)
C#
Legend legend = new Chart();
ChartControl.Legends.Add(legend);
The Layout and Position topic in the Legend book discusses in detail how to position the legend and change its layout.
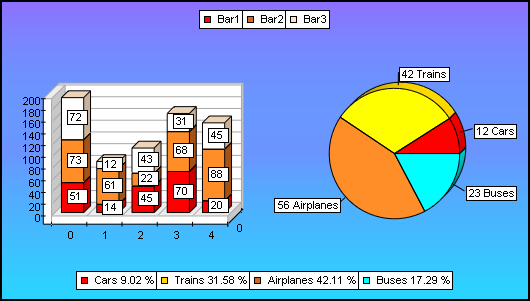
The following sample creates two simple charts: a stack bar chart and a pie chart that are both displayed by the control.
VB.NET
' configure the legend displaying the data for the stock
Dim legend1 As Legend = CType(nChartControl1.Legends(0), Legend)
legend1.SetPredefinedLegendStyle(PredefinedLegendStyle.Right)

' configure stack bar chart

Dim chart1 As Chart =   chartControl1.Charts.GetAt(0)

' add the first bar
Dim bar1 As BarSeries = CType(chart1.Series.Add(SeriesType.Bar), BarSeries)
bar1.Name = "Bar1"
bar1.MultiBarMode = MultiBarMode.Series

' add the second bar
Dim bar2 As BarSeries = CType(chart1.Series.Add(SeriesType.Bar), BarSeries)
bar2.Name = "Bar2"
bar2.MultiBarMode = MultiBarMode.Stacked

' add the third bar
Dim bar3 As BarSeries = CType(chart1.Series.Add(SeriesType.Bar), BarSeries)
bar3.Name = "Bar3"
bar3.MultiBarMode = MultiBarMode.Stacked

' position data labels in the center of the bars
bar1.DataLabels.VertAlign = VertAlign.Center
bar2.DataLabels.VertAlign = VertAlign.Center
bar3.DataLabels.VertAlign = VertAlign.Center
bar1.DataLabels.ArrowLength = 0
bar2.DataLabels.ArrowLength = 0
bar3.DataLabels.ArrowLength = 0

' change the color of the second and third bars
bar2.BarFillEffect.SetSolidColor(Color.Chocolate)
bar3.BarFillEffect.SetSolidColor(Color.Bisque)
bar1.Values.FillRandomRange(5, 10, 100)
bar2.Values.FillRandomRange(5, 10, 100)
bar3.Values.FillRandomRange(5, 10, 100)

' display this chart at the left side of the control
chart1.Margins = New RectangleF(0, 0, 50, 100)

' add a new legend
Dim legend As Legend =  New Legend()
chartControl1.Legends.Add(legend)
legend.SetPredefinedLegendStyle(PredefinedLegendStyle.Bottom)

' configure a pie chart
Dim chart2 As Chart =  New Chart()

' always first add the chart before modifying properties
chartControl1.Charts.Add(chart2)

' display the pie data on legend 2
chart2.DisplayOnLegend = 1
Dim pie As PieSeries = CType(chart2.Series.Add(SeriesType.Pie), PieSeries)
pie.AddPie(12, 0, "Cars", New FillEffect(Color.Red), New LineProperties())
pie.AddPie(42, 0, "Trains", New FillEffect(Color.Gold), New LineProperties())
pie.AddPie(56, 0, "Airplanes", New FillEffect(Color.Chocolate), New LineProperties())
pie.AddPie(23, 0, "Buses", New FillEffect(Color.Cyan), New LineProperties())
pie.Appearance.FillMode = AppearanceFillMode.DataPoints pie.Legend.Mode = SeriesLegendMode.DataPoints
pie.Legend.Format = "<label> <percent>"
chart2.Margins = New RectangleF(50, 0, 50, 100)
chartControl1.Background.FillEffect.SetPredefinedAdvancedGradient(AdvancedGradientScheme.CalmWater2, 12)
C#
// configure the legend displaying the data for the stock Legend legend1 = (Legend)ChartControl.Legends[0];
// configure stack bar chart Chart chart1 = chartControl1.Charts.GetAt(0);
// add the first bar BarSeries bar1 = (BarSeries)chart1.Series.Add(SeriesType.Bar); bar1.Name = "Bar1"; bar1.MultiBarMode = MultiBarMode.Series;
// add the second bar BarSeries bar2 = (BarSeries)chart1.Series.Add(SeriesType.Bar); bar2.Name = "Bar2"; bar2.MultiBarMode = MultiBarMode.Stacked;
// add the third bar BarSeries bar3 = (BarSeries)chart1.Series.Add(SeriesType.Bar); bar3.Name = "Bar3"; bar3.MultiBarMode = MultiBarMode.Stacked;
// position data labels in the center of the bars bar1.DataLabels.VertAlign = VertAlign.Center; bar2.DataLabels.VertAlign = VertAlign.Center; bar3.DataLabels.VertAlign = VertAlign.Center; bar1.DataLabels.ArrowLength = 0; bar2.DataLabels.ArrowLength = 0; bar3.DataLabels.ArrowLength = 0; // change the color of the second and third bars bar2.BarFillEffect.SetSolidColor(Color.Chocolate); bar3.BarFillEffect.SetSolidColor(Color.Bisque); bar1.Values.FillRandomRange(5, 10, 100); bar2.Values.FillRandomRange(5, 10, 100); bar3.Values.FillRandomRange(5, 10, 100);
// display this chart at the left side of the control chart1.Margins = new RectangleF(0, 0, 50, 100);
// add a new legend Legend legend = new Legend(); chartControl1.Legends.Add(legend); legend.SetPredefinedLegendStyle(PredefinedLegendStyle.Bottom);
// configure a pie chart Chart chart2 = new Chart();
// always first add the chart before modifying properties m_ChartControl.Charts.Add(chart2);
// display the pie data on legend 2 chart2.DisplayOnLegend = 1; PieSeries pie = (PieSeries)chart2.Series.Add(SeriesType.Pie); pie.AddPie(12, 0, "Cars", new FillEffect(Color.Red), new LineProperties()); pie.AddPie(42, 0, "Trains", new FillEffect(Color.Gold), new LineProperties()); pie.AddPie(56, 0, "Airplanes", new FillEffect(Color.Chocolate), new LineProperties()); pie.AddPie(23, 0, "Buses", new FillEffect(Color.Cyan), new LineProperties()); pie.Appearance.FillMode = AppearanceFillMode.DataPoints; pie.Legend.Mode = SeriesLegendMode.DataPoints; pie.Legend.Format = "<label> <percent>"; chart2.Margins = new RectangleF(50, 0, 50, 100); chartControl1.Background.FillEffect.SetPredefinedAdvancedGradient(AdvancedGradientScheme.CalmWater2, 12);
The preceding code will produce the following chart: