Logarithmic scale mode is often used as an alternative to the default scale mode (numeric) for the PrimaryY and SecondaryY chart axes (for details, see StandardAxis Enumeration). When operating in this mode, the axes scale the data contained in the data series logarithmically.
The properties of the logarithmic scale are controlled through an instance of the AxisScaleLogarithmic class, which is accessible through the LogarithmicScale property of the Axis class. The AxisScaleLogarithmic class is a direct descendant of the AxisScaleValue class and inherits all its functionality. It also implements control over the following aspects of a logarithmic scale.
Controlling the Logarithmic Base
The user can control the base of the logarithm with the LogarithmBase property. It is by default set to 10 (Base10 logarithm). The following code changes the logarithm base of the PrimaryY axis to 2:
| VB.NET | |
|---|---|
Chart.Axis(StandardAxis.PrimaryY).LogarithmScale.LogarithmBase = 2 | |
| C# | |
|---|---|
Chart.Axis(StandardAxis.PrimaryY).LogarithmScale.LogarithmBase = 2; | |
Controlling Major Tick Generation in Logarithmic Scale Mode
The user can control the mode in which the major ticks are generated with the MajorTickMode property, which is of type MajorTickModeLogarithmic and can accept the following values (for details, see MajorTickModeLogarithmic Enumeration):
Manual
PowAutoStep
PowCustomStep
AbsAutoStep
AbsCustomStep
The following is a description of these modes:
- Manual: When operating in this mode, the scale does not produce any ticks. It is up to the user to specify values on which major ticks should be displayed. The following code displays ticks on values 10, 100, and 1000 of the PrimaryY axis:
| VB.NET | |
|---|---|
| |
| C# | |
|---|---|
| |
- Power Auto Step: In this mode the scale produces automatic major ticks at values that are exact products of the logarithm base. The following is the row of values produced by this mode:
logbase n, logbase (n + autostep) ... logbase (n + autostep * m)
where:
logbase = the base of the logarithm specified by the LogarithmBase property
autostep = an automatically calculated value
n = the smallest integer value for which logbase n >= min
m = the largest integer value for which logbase (n + autostep * m) <= max
The scale automatically calculates the step of the power argument. The user can control the density of the generated major ticks with the MaxTickCount property (inherited from the AxisScaleValue class). The following code instructs the PrimaryY axis to generate no more than 10 major ticks that are exact products of the logarithm base with an automatic power step.
| VB.NET | |
|---|---|
| |
| C# | |
|---|---|
| |
- Power Custom Step: In this mode the scale produces automatic major ticks at values that are exact products of the logarithm base. The scale will use the value of the CustomStep property as the step for the power argument. The following is the row of values produced by this mode:
logbase n, logbase (n + customstep) ... logbase (n + customstep * m)
where:
logbase = the base of the logarithm specified by the LogarithmBase property
customstep = the custom step specified by the CustomStep property
n = the smallest integer value for which logbase n >= min
m = the largest integer value for which logbase (n + customstep * m) <= max
For example, if logbase is 10, custom step is 2, min value is 0.8, and max value is 10002, the major ticks produced will be:
1, 100, 10000 (n is 0, m is 2)
The following code instructs the logarithmic scale to produce major ticks at values that are the exact product of the logarithm base with a custom power step 2.
| VB.NET | |
|---|---|
| |
| C# | |
|---|---|
axis.LogarithmicScale.MajorTickMode = MajorTickModeLogarithmic.PowCustomStep; | |
- Absolute Auto Step: In this mode the scale will produce automatic major ticks at equal intervals. The step is automatically determined by the scale. In this mode the user can control the density of the automatically generated major ticks with the MaxTickCount property. The following is the row of values produced by this mode:
min, min + autostep ... min + autostep * n
where:
min = is the minimum value of the scale
autostep = an automatically calculated value
n = the largest integer value for which min + autostep * n <= max
The following code instructs the PrimaryY axis to operate in Absolute Auto Step mode and generate no more than 10 major ticks.
| VB.NET | |
|---|---|
| |
| C# | |
|---|---|
axis.LogarithmicScale.MajorTickMode = MajorTickModeLogarithmic.AbsAutoStep; | |
- Absolute Custom Step: In this mode the scale will produce automatic major ticks at equal intervals. The step is specified by the user. The following is the row of values produced by this mode:
min, min + customstep ... min + customstep * n
where:
min = is the minimum value of the scale
customstep = the value specified by the CustomStep property
n = the largest integer value for which min + autostep * n <= max
The following code instructs the PrimaryY axis to operate in Absolute Custom Step mode with step 1000.
| VB.NET | |
|---|---|
| |
| C# | |
|---|---|
| |
| Demonstration of the Logarithmic Major Tick modes | |
| Manual (from Series Values) | Power with Auto Step |
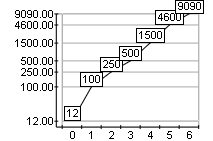 |
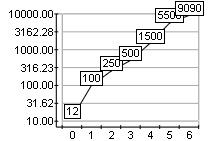 |
| Power with Custom Step (in this case 1) |
Absolute with Auto Step (in this case 5000) |
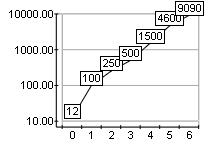 |
 |
| Absolute with Custom Step (in this case 4600) |
|
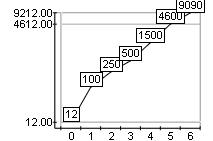 |
|
Controlling Minor Ticks in Logarithmic Scale Mode
If minor ticks are automatically generated by the logarithmic scale ( AutoMinorTicks is set to true), the user can control the density of the minor ticks with the help of the MinorTickCount property (inherited from AxisScaleValue ). This property specifies the number of minor ticks between two major ticks. By default the minor ticks are displayed at equal absolute value intervals. The user can override this behavior and display them on equal power intervals by setting the ExponentMinorTicks to true:
| VB.NET | |
|---|---|
Chart.Axis(StandardAxis.PrimaryY).ExponentMinorTicks = True | |
| C# | |
|---|---|
Chart.Axis(StandardAxis.PrimaryY).ExponentMinorTicks = true; | |
Related Examples
Windows Forms: Axes\Scaling\Logarithmic Scale
See Also
Axis Scales | Axis | AxisScale | AxisScaleValue | AxisScaleLogarithmic