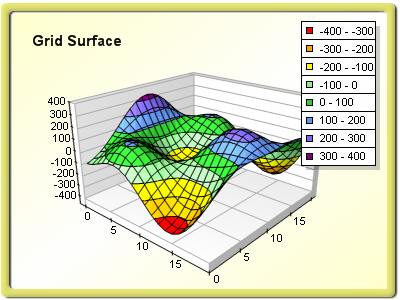
The grid surface chart displays a surface with user-defined elevation values for each data point and with X and Y coordinates that form a rectangular grid. Grid surface series are created with the GridSurfaceSeries class. It is derived from the SurfaceSeriesBase class and inherits its functionality. The following figure represents a typical grid surface chart.
Grid Surface Data
The surface elevation data is managed with the help of a GridSurfaceData object, which is accessible through the Data property of the GridSurfaceSeries class. The data is stored in a two-dimensional array of data points, where each data point has only one double value (the elevation value). The size of the surface is controlled with the SetGridSize method of the GridSurfaceData class. It accepts two integer parameters: sizeX (defines the width of the surface) and sizeZ (defines the depth of the surface). The SetValue method sets a value at a specified X and Z index; with this method the user actually feeds the surface data. The supplied value must be of type System.Double. If you need to specify an invalid data point at some position, you must use DBNull.Value instead of a double value. The following example creates a grid surface series with 9 data points (4 segments) and fills it with some data.
| VB.NET | |
|---|---|
| |
| C# | |
|---|---|
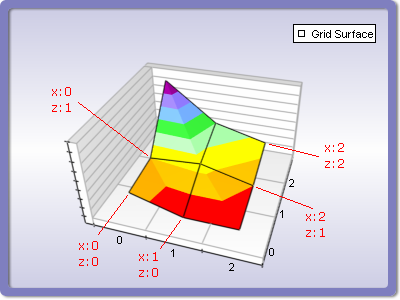
GridSurfaceSeries s = (GridSurfaceSeries)chart.Series.Add(SeriesType.GridSurface); s.FrameStyle = SurfaceFrameStyle.Mesh; s.Data.SetGridSize(3, 3); | |
The following figure displays the generated surface, as well as the order of X and Z indices in a surface grid.
The GetValue method helps you read the value at the specified X and Z indices. It returns either an object of type System.Double or DBNull.Value (in the case of an invalid value). The GridSizeX and GridSizeZ properties can be used to retrieve, respectively, the current X and Z size of the surface data.
Related Examples
Windows Forms: Series\Grid Surface\General
Windows Forms: Series\Grid Surface\Wire Frame
Windows Forms: Series\Grid Surface\Contour
Windows Forms: Series\Grid Surface\Empty Data Points
Windows Forms: Series\Grid Surface\Fill Effect
See Also
SurfaceSeriesBase | GridSurfaceSeries | Common Surface Functionality