Axis constant lines are lines displayed at custom axis values and are primarily used when the user wants to visually emphasize some axis value for the chart being displayed. Each constant line is represented by an AxisConstLine object. Constant lines are contained in a collection of type AxisConstLineCollection , which is accessible through the ConstLines property of the Axis class. The following code saves a reference to the constant line collection of the PrimaryY axis:
| VB.NET | |
|---|---|
| |
| C# | |
|---|---|
| |
The image on figure 1 represents a typical chart with constant lines:
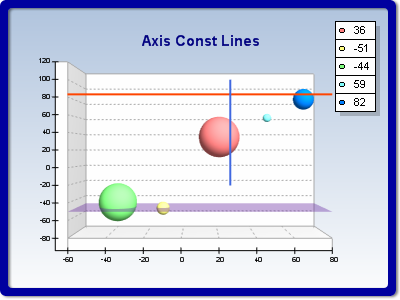
figure 1.
Creating a New Constant Line
The Add method of the AxisConstLineCollection class creates a new constant line and returns a reference to it. The following code will create a new constant line on the PrimaryY axis:
| VB.NET | |
|---|---|
Dim constLine As AxisConstLine = constLines.Add() | |
| C# | |
|---|---|
AxisConstLine constLine = constLines.Add(); | |
Once the constant line has been created, you can modify its Value property, which associates the constant line with a specific axis value. The following code will display the newly created line on value 20 of the PrimaryY axis:
| VB.NET | |
|---|---|
constLine.Value = 20 | |
| C# | |
|---|---|
constLine.Value = 20; | |
Controlling the Constant Line Style
Constant lines can be displayed as simple lines or as planes. The style of a constant line is controlled through the Style property of the AxisConstLine class. It is of type ConstLineStyle and can accept the following values (for details, see ConstLineStyle Enumeration):
Line
Plane
By default it is set to Line. The following code switches the constant line style to Plane:
| VB.NET | |
|---|---|
constLine.Style = ConstLineStyle.Plane | |
| C# | |
|---|---|
constLine.Style = ConstLineStyle.Plane; | |
Controlling a Constant Line's Appearance
When a constant line is displayed as a line, the user can control its appearance with the LineProperties object, accessible through the LineProps property. The following example displays the line in blue:
| VB.NET | |
|---|---|
| |
| C# | |
|---|---|
| |
When a constant line is displayed as a plane, the user can control the filling of the plane with the FillEffect object, accessible through the FillEffect property. In this case, LineProps controls the border of the plane. The following code displays a plane constant line with a red filling and a black border:
| VB.NET | |
|---|---|
| |
| C# | |
|---|---|
| |
Controlling a Constant Line's Begin and End Values
Constant lines have begin and end values. By default constant lines are displayed across the entire chart. Sometimes it may be useful to specify the beginning and ending of the constant line with specific values of the corresponding axis (parallel to the constant line). This mode is enabled when the user sets the EnableBeginEnd property to true. The user then specifies begin and end values for the constant line with the BeginValue and EndValue properties. Depending on which axis the constant lines belong to, the user is able to specify an axis with which the begin and end values will be synchronized. This is achieved with the BeginEndAxis property. The lines of the vertical axes accept as a parameter only the horizontal axes. The lines of the horizontal and depth axes accept the vertical axes as parameters.
The following code displays the line created in the previous code fragment from value 10 to value 20 of the PrimaryX axis.
| VB.NET | |
|---|---|
| |
| C# | |
|---|---|
| |
Related Examples
Windows Forms: Axes\Attributes\Constlines
See Also
Axis | AxisConstLineCollection | AxisConstLine | Axis Stripes