Xceed Chart for WinForms v4.4 Documentation
Welcome to Xceed Chart for WinForms v4.4 / User Guide / Series / Bar Series / Cluster Stack Combinations

In This Topic
    Cluster Stack Combinations
    In This Topic

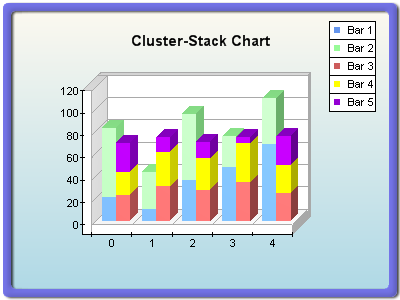
    Xceed Chart for WinForms can display cluster stack combination bar charts. The following figure demonstrates a typical chart of this class: 


    figure 1.

    Creating the Cluster Stack Combination Bar Series

    The following code will create the bar series involved in this chart:

    VB.NET  

    ' there is one chart created by default
    Dim chart As Chart = CType(chartControl1.Charts(0), Chart)

    ' first cluster
    Dim c1bar1 As BarSeries = CType(chart.Series.Add(SeriesType.Bar), BarSeries)
    c1bar1.BarStyle = BarStyle.SmoothEdgeBar

    ' second cluster
    Dim c2bar1 As BarSeries = CType(chart.Series.Add(SeriesType.Bar), BarSeries)
    Dim c2bar2 As BarSeries = CType(chart.Series.Add(SeriesType.Bar), BarSeries)

    c2bar1.MultiBarMode = MultiBarMode.Clustered ' display next to c1bar1
    c2bar2.MultiBarMode = MultiBarMode.Stacked ' stack on c2bar1

    c1bar1.BarStyle = BarStyle.Cone
    c1bar2.BarStyle = BarStyle.Cone

    c2bar1.BarFillEffect.SetSolidColor(Color.Green)
    c2bar2.BarFillEffect.SetSolidColor(Color.Chocolate)

    ' third cluster
    Dim c3bar1 As BarSeries = CType(chart.Series.Add(SeriesType.Bar), BarSeries)
    Dim c3bar2 As BarSeries = CType(chart.Series.Add(SeriesType.Bar), BarSeries)
    Dim c3bar3 As BarSeries = CType(chart.Series.Add(SeriesType.Bar), BarSeries)

    c3bar1.MultiBarMode = MultiBarMode.Clustered ' display next to c2bar1
    c3bar2.MultiBarMode = MultiBarMode.StackedPercent ' stack percent on c3bar1
    c3bar3.MultiBarMode = MultiBarMode.StackedPercent ' stack percent on c3bar2

    c3bar1.BarStyle = BarStyle.Cylinder
    c3bar2.BarStyle = BarStyle.Cylinder
    c3bar3.BarStyle = BarStyle.Cylinder

    c3bar1.BarFillEffect.SetSolidColor(Color.Magenta)
    c3bar2.BarFillEffect.SetSolidColor(Color.Cyan)
    c3bar3.BarFillEffect.SetSolidColor(Color.Yellow)

    c3bar1.DisplayOnAxis(StandardAxis.PrimaryY, False)
    c3bar1.DisplayOnAxis(StandardAxis.SecondaryY, True)

    c3bar2.DisplayOnAxis(StandardAxis.PrimaryY, False)
    c3bar2.DisplayOnAxis(StandardAxis.SecondaryY, True)

    c3bar3.DisplayOnAxis(StandardAxis.PrimaryY, False)
    c3bar3.DisplayOnAxis(StandardAxis.SecondaryY, True)
    C#  

    // there is one chart created by default
    Chart chart = (Chart)chartControl1.Charts[0];

    // first cluster
    BarSeries c1bar1 = (BarSeries)chart.Series.Add(SeriesType.Bar);
    c1bar1.BarStyle = BarStyle.SmoothEdgeBar;

    // second cluster
    BarSeries c2bar1 = (BarSeries)chart.Series.Add(SeriesType.Bar);
    BarSeries c2bar2 = (BarSeries)chart.Series.Add(SeriesType.Bar);

    c2bar1.MultiBarMode = MultiBarMode.Clustered; // display next to c1bar1
    c2bar2.MultiBarMode = MultiBarMode.Stacked; // stack on c2bar1

    c1bar1.BarStyle = BarStyle.Cone;
    c1bar2.BarStyle = BarStyle.Cone;

    c2bar1.BarFillEffect.SetSolidColor(Color.Green);
    c2bar2.BarFillEffect.SetSolidColor(Color.Chocolate);

    // third cluster
    BarSeries c3bar1 = (BarSeries)chart.Series.Add(SeriesType.Bar);
    BarSeries c3bar2 = (BarSeries)chart.Series.Add(SeriesType.Bar);
    BarSeries c3bar3 = (BarSeries)chart.Series.Add(SeriesType.Bar);

    c3bar1.MultiBarMode = MultiBarMode.Clustered; // display next to c2bar1
    c3bar2.MultiBarMode = MultiBarMode.StackedPercent; // stack percent on c3bar1
    c3bar3.MultiBarMode = MultiBarMode.StackedPercent; // stack percent on c3bar2

    c3bar1.BarStyle = BarStyle.Cylinder;
    c3bar2.BarStyle = BarStyle.Cylinder;
    c3bar3.BarStyle = BarStyle.Cylinder;

    c3bar1.BarFillEffect.SetSolidColor(Color.Magenta);
    c3bar2.BarFillEffect.SetSolidColor(Color.Cyan);
    c3bar3.BarFillEffect.SetSolidColor(Color.Yellow);

    c3bar1.DisplayOnAxis(StandardAxis.PrimaryY, false);
    c3bar1.DisplayOnAxis(StandardAxis.SecondaryY, true);
    c3bar2.DisplayOnAxis(StandardAxis.PrimaryY, false);
    c3bar2.DisplayOnAxis(StandardAxis.SecondaryY, true);
    c3bar3.DisplayOnAxis(StandardAxis.PrimaryY, false);
    c3bar3.DisplayOnAxis(StandardAxis.SecondaryY, true);

    As you can see from the code above, the component uses a simple technique to specify the position of the bar series. If a series MultiBarMode is set to Clustered, it is displayed next to the previous Clustered series, or in case such series does not exist, next to the previous bar series with mode set to Series. In the context of the example, c2bar1 is displayed next to c1bar1, while c3bar1 is displayed next to c2bar1. 

    If a series MultiBarMode is set to Stacked or StackedPercent, it is stacked on the previous bar series with Clustered mode, or in the case where such a series does not exist, next to the previous bar series with mode Series. Multiple bar series can be stacked on a bar series with mode Clustered or Series. The type of stacking (stacked or stacked percent) is determined by the last series in the stack. In the context of the previous example, the following code will not change the third stack stacking mode:

    VB.NET  
    c3bar2.MultiBarMode = MultiBarMode.Stacked ' instead of StackedPercent
    
    C#  
    c3bar2.MultiBarMode = MultiBarMode.Stacked; // instead of StackedPercent
    

    The following code will display the third stack in Stacked mode:

    VB.NET  
    c3bar3.MultiBarMode = MultiBarMode.Stacked ' instead of StackedPercent
    
    C#  
    c3bar3.MultiBarMode = MultiBarMode.Stacked; // instead of StackedPercent
    

    The component will throw an exception if you try to change the MultiBarMode of the c1bar1 bar series to Clustered, Stacked or StackedPercent, since at least one bar series with mode Series must have already been created (to be used as the series depth space holder).

    Related Examples

    Windows Forms: Series\Bar\Cluster Stack Combination

    See Also

    BarSeries