Xceed Chart for WinForms has an integrated wizard that can help you configure your chart. Simply select one of the many predefined settings for the key chart elements the wizard exposes.
To launch the wizard, right-click on the ChartControl in your Windows Forms application and select the "Chart Wizard..." menu command.
The following is a brief description of the wizard property pages:
-
Chart
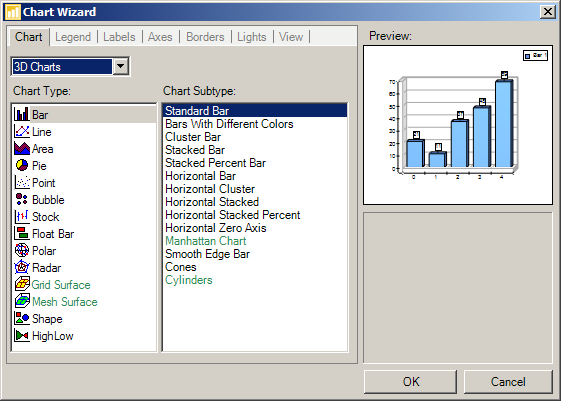
From this property page, you can select a predefined chart template. Use the combo box to choose between 2D and 3D charts, then select the desired chart type from the left list and finally the chart sub-type from the right list. Some charting types such as Grid Surface and Mesh Surface are present only if "3D Charts" is selected in the combo box. -
Legend
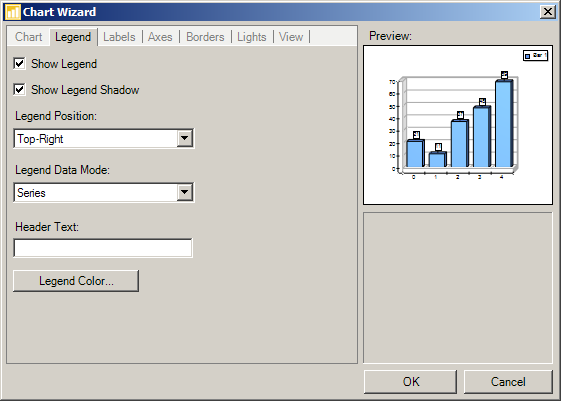
From this property page, the user can control basic legend settings such as position, data item mode, legend header, etc. -
Labels
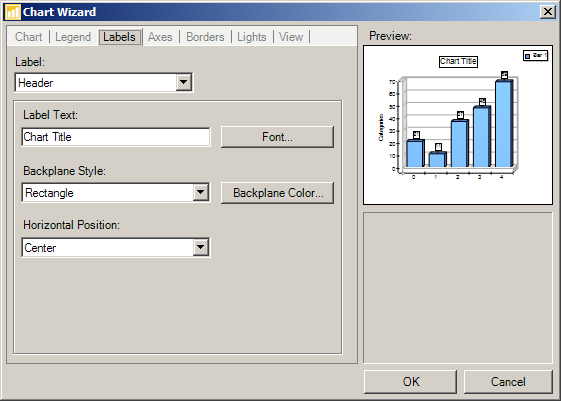
This property page controls the text and appearance of the chart image's header and footer. -
Axes
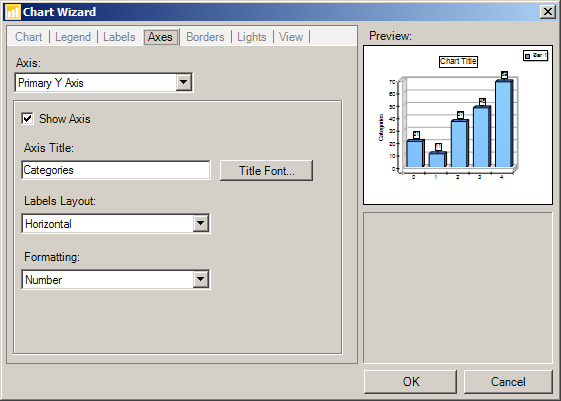
From this property page, the user can control basic axis settings, including axis visibility, axis title text and appearance, label layout, and value formatting. -
Borders
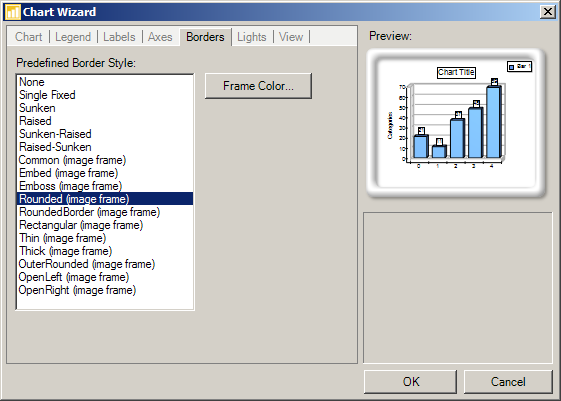
From this property page, the user can select a border for the chart canvas. The borders with the "(image frame)" suffix are artistic image borders.
-
Lights
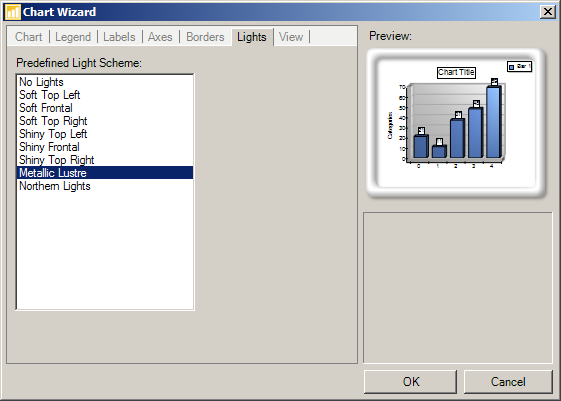
Xceed Chart for WinForms has several predefined light schemes. The user can easily select one from this property page. -
View
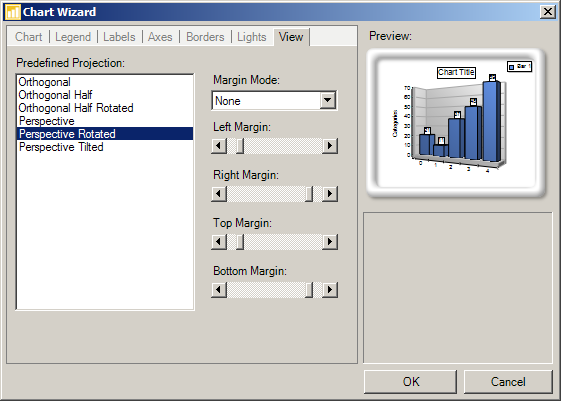
Xceed Chart for WinForms has a large set of predefined projections. The user can easily select one from this property page.